In out last adventure we got did a basic example of Apache Streams with Twitter data. This week we’re going to extend that example with Facebook data! Also note, if this seems a little light it is because it’s not that different from the last post and the full explanations are there. Our goal here is not to explain all of Apache Streams (last week) but to begin branching out into other providers.
Getting credentialed through Facebook
The first step in any new provider is going to be to go get credentials. To get Facebook credentials you’ll need to visit Facebook App Dashboard. Once you get there and sign up, you’ll need to click “Add new App” (top right). After you’ve create the new app click “Settings”, in the panel to right. Here you will see the “AppID”, and if you click “Click show to see App Secret”, you’ll have two important strings you’re going to need soon.
The final piece of credentials you’ll need to set up is a userAccessToken. The easiest way to do this is to go to Graph API Explorer. These are temporary tokens that expire quickly (after an hour or so). This isn’t a “production” grade approach, but it is a good way to test things out and get going. Persistent tokening with Facebook is out of scope of this blog post and things which I care about at this point in my life.
Setting up the Stream
First you’ll need to add some dependencies, including the Facebook provider jar:
Next we’ll create the config files. We dynamically create this string based on the values we enter at our little GUI we made. The info section is supposed list which users your are interested in. I think for this provider it is not important especially considering the way we got our AccessToken. In this case it basically just gives you everything you are entitled to and nothing else. Specifically this provider gives you a stream of everything your friends are doing.
%spark

val credentials =
s"""
{
facebook {
oauth {
appId = "$appId"
appSecret = $appSecret
userAccessToken = $userAccessToken
}

info = [
rawkintrevo
]

}
}
"""
val credentialsConfig = ConfigFactory.parseString(credentials)

val typesafe = ConfigFactory.parseString(credentials)
val config = new ComponentConfigurator(classOf[FacebookUserstreamConfiguration]).detectConfiguration(typesafe, "facebook");
val provider = new FacebookFriendFeedProvider(config, classOf[org.apache.streams.facebook.Post] );

val timeline_buf = scala.collection.mutable.ArrayBuffer.empty[Object]

provider.prepare()
provider.startStream()
This should look very similar to the setup we did for the Twitter stream, except of course we are using FacebookUserstreamConfiguration and the FacebookFriendFeedProvider classes, and our stream will consist of org.apache.streams.facebook.Posts
%spark
//while(provider.isRunning()) {
for (i <- 0 to 20) {
  val resultSet = provider.readCurrent()
  resultSet.size()
  val iterator = resultSet.iterator();
  while(iterator.hasNext()) {
    val datum = iterator.next();
    //println(datum.getDocument)
    timeline_buf += datum.getDocument
  }
  println(s"Iteration $i")
}
provider.cleanUp()
The key difference here is that we stop running after 40 iterations. That should be PLENTY of data. If we use the while loop, this would run forever updating each time our friends had another action.
Now we have to process our tweets facebook posts.
%spark
import org.apache.streams.converter.ActivityConverterProcessor
import org.apache.streams.facebook.processor.FacebookTypeConverter
import org.apache.streams.core.StreamsProcessor
import org.apache.streams.pojo.json.Activity
import scala.collection.JavaConverters
import scala.collection.JavaConversions._

import org.apache.streams.pojo.json.Activity
import org.apache.streams.facebook.Post
import org.apache.streams.facebook.Page

//val converter = new ActivityConverterProcessor()
val converter = new FacebookTypeConverter(classOf[Post], classOf[Activity])

converter.prepare()

val status_datums = timeline_buf.map(x => new StreamsDatum(x))
val activity_datums = status_datums.flatMap(x => converter.process(x)).map(x => x.getDocument.asInstanceOf[Activity])

import org.apache.streams.jackson.StreamsJacksonMapper;

val mapper = StreamsJacksonMapper.getInstance();
val activitiesRDD = sc.parallelize(activity_datums.map(o => mapper.writeValueAsString(o)))

val activitiesDF = sqlContext.read.json(activitiesRDD)

activitiesDF.registerTempTable("activities")
The only line that changed here was
//val converter = new ActivityConverterProcessor()
val converter = new FacebookTypeConverter(classOf[Post], classOf[Activity])
In the future, we won’t even need to change that line! But for now, we have to explicitly set the FacebookTypeConverter and let it know we are expecting to see Posts and we want Activities (which are Activity Streams 1.0 compliant.)
At this point it is pretty much the same as last time. Feel free to check out the schema of the activitiesDF by running
%spark.spark

activitiesDF.printSchema()
If you are comparing to the tweet activities you collected before, you’ll notice there are some places where Facebook post-based activities contain more or less information, but at a high level the schema is similar: actor, likes, rebroadcasts, etc.
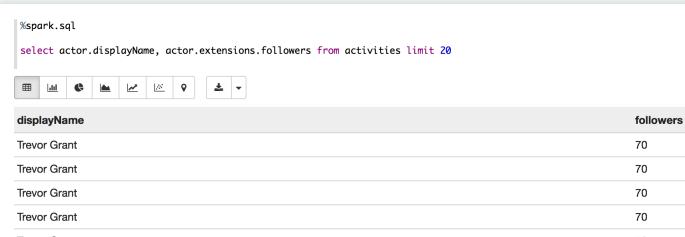
Let’s do a simple SQL query that won’t reveal the identity of any of my friends…
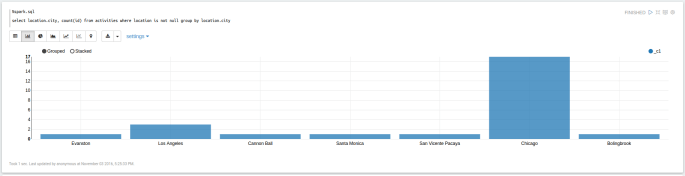
%spark.sql

select location.city, count(id) from activities where location is not null group by location.city
And here we see most of my friends and friends of friends of friend hail from Chicago, which makes sense because it is the best city in the country, and my friends aren’t dummies.
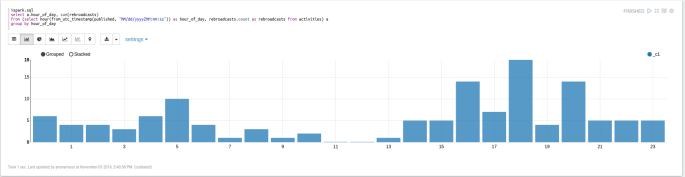
We’ll also need to do a little post-processing on some of these columns. For instance, times are all given as stings- so to work with them as dates we can do something like this:
%spark.sql
select a.hour_of_day, sum(rebroadcasts)
from (select hour(from_utc_timestamp(published, "MM/dd/yyyyZHH:mm:ss")) as hour_of_day, rebroadcasts.count as rebroadcasts from activities) a
group by hour_of_day
Notes
Zeppelin’s Table API doesn’t handle new lines well. If you try to build a table of the messages, it’s not going to work out great. I leave it as an exercise to the user to clean that up.
Do you know the origin story of the Apache Software Foundation? Let me tell you the short version: In the late 90s most of the internet was being powered by a web-server that no one was maintaining. It was a good product, but no one was feeding and caring for it (e.g. bug fixes, security updates). On BBS boards a number of people were talking about the issue, and how before too long they were going to have to start writing their own web-servers to replace it.
Around this time they realized, none of their respective companies competed based on web-servers; they were selling books, and flights, and hosting gifs of dancing hamsters. It made more sense for everyone to work together on a common web-server project- as a web server is something everyone needs, but no one uses for competitive advantage. Thus the Apache Web Server was born, and with it the Apache Software Foundation and the legally defensible, yet business friendly copyright.
This history lesson has a point, fast forward to present day and enter Apache Streams-incubating- lots of people from several industries are looking at social data from across multiple providers, everyone builds their own processors to transform into a useful format- that might be extracting text from tweets and Facebook posts. No one competes to do a ‘better job’ extracting data – its a straight forward task to connect to a providers API and reshaping a JSON into a table or other object- but it is something that everyone has to do. That’s where Apache Streams comes in.
Apache Streams is a package of tools for:
1. Connecting to a provider (e.g. Facebook or Twitter)
2. Retrieving data and reshaping it into a WC3 common format
3. Storing that data in a specified target (e.g. local file or database)
4. Doing this all in the JVM or a distributed engine (e.g. Apahce Flink or Apache Spark)
5. Much of this can be done with JSON configurations
We are going to write code to build this stream, but soon (upcoming post) we will show how to do it code free.
About Apache Streams
High level, Apache Streams is a framework that collects data from multiple social media providers, transform the data into a common, WC3 backed, format known as Activity Streams, and persist the data to multiple endpoints (e.g. files or databases).
It is also possible to use Apache Streams inline with regular Java/Scala code, which is what we will be demonstrating here today.
Step 1. Configuring
This post assuming you have Apache Zeppelin installed. Other posts on this blog explain how to setup up Zeppelin on clusters- you don’t need any of that. A local version of Zeppelin will work just find for what we’re about to do- see the official Zeppelin side for getting started
Method 1- The %spark.dep interpreter.
This is the fail-safe method- however it relies on the deprecated %dep interpreter.
In the first paragraph of the notebook enter the following:
What we’ve done here is add the Apache Snapshots repository, which contains the Streams 0.4 Snapshots. A Snapshot is a most up-to-date version of a project. It’s not production grade but it has all of the latest and greatest features- unstable though they may be. At the time of writing Apache Streams is in the process of releasing 0.4.
If you get an error:
Must be used before SparkInterpreter (%spark) initialized
Hint: put this paragraph before any Spark code and restart Zeppelin/Interpreter
Go to the interpreters page and restart the interpreter. (Click on “Anonymous” at the top right, a drop down menu will pop up, click on “Interpreters”, then at the new page search or scroll down to “Spark”. In the top right of the Spark interpreter tile there are three buttons, “Edit”, “Restart”, “Remove”. Click “Restart” then try running the paragraph again.
Method 2- The config GUI
Follow the directions directly above for accessing the interpreter config GUI in Zeppelin. This time however, click “Edit”.
You will see Properties and Values. Scroll down and find the property:
This step is equivalent to the z.addRepo(... line in the other method.
Now scroll down past the Properties and Values to the Dependencies section. In the Artifact section, add org.apache.streams:streams-provider-twitter:0.4-incubating-SNAPSHOT and org.apache.streams:streams-converters:0.4-incubating-SNAPSHOT, hit the little “+” button to the right after adding each. Finally save the changes (little button at bottom), which will restart the interpreter.
Step 2. Getting credentials from Twitter
Each provider will have its own method for authenticating the calls you make for data, and its own process for granting credentials. In the case of Twitter, go to https://apps.twitter.com/.
There are several great blog posts you can find if you Google “create twitter app”. I’ll leave you to go read and learn. It’s a fairly painless process.
When you create the app, or if you already have an app- we need the following information:
– Consumer Key
– Consumer Secret
– Access Token
– Access Token Secret
Step 3. Configuring the Stream
First we are going to use the Apache Zeppelin’s Dynamic Forms to make it easy for users to copy and paste their Twitter Credentials into the program. Could you hard code your credentials? Sure, but this is a demo and we’re showing off.
The UserID is who we are going to follow. It should work with User ID’s or Twitter handles, however at the time of writing there is a bug where only UserIDs are available. In the mean time, use an online tool to convert usernames into IDs
You’ll see that we are simply getting values to fill into a string that looks sort of like a JSON called hocon. This config string, is the makings of the config JSONs that would allow you to define a Stream with out very little code. For the sake of teaching however, we’re going to cut code anyway.
Full setup Paragraph
%spark
val consumerKey = z.input("ConsumerKey", "")
val consumerSecret = z.input("ConsumerSecret", "")
val accessToken = z.input("AccessToken", "")
val accessTokenSecret = z.input("AccessTokenSecret", "")
val userID = z.input("UserID", "")

val hocon = s"""
twitter {
oauth {
consumerKey = "$consumerKey"
consumerSecret = "$consumerSecret"
accessToken = "$accessToken"
accessTokenSecret = "$accessTokenSecret"
}
retrySleepMs = 5000
retryMax = 250
info = [ $userID ]
}
"""
Note: Becareful when sharing this notebook, your credentials (the last ones used) will be stored in the notebook, even though they are not hard-coded.
Step 4. Writing the Pipeline
We want to collect tweets, transform them into ActivityStreams objects, and persist the objects into a Spark DataFrame for querying and analytics.
After taking care of our imports, we will create an ArrayBuffer to which we will add tweets. Note, if you have any problems with the imports- check that you have done Step 1 correctly.
val timeline_buf = scala.collection.mutable.ArrayBuffer.empty[Object]
Next, we are going to parse the config string we created in the last step into a ComponentConfigurator which will be used to setup the Stream. Again, this all could be handled by Streams its self, we are literally recreating the wheel slightly for demonstration purposes.
val typesafe = ConfigFactory.parseString(hocon)
val config = new ComponentConfigurator(classOf[TwitterUserInformationConfiguration]).detectConfiguration(typesafe, "twitter");
In the remaining code, we create a Streams provider from our config file, run it and collect tweets into our array buffer.
Full paragraph worth of code for copy+paste
"%spark
import com.typesafe.config._
import java.util.Iterator

import org.apache.streams.config._
import org.apache.streams.core._

import org.apache.streams.twitter.TwitterUserInformationConfiguration
import org.apache.streams.twitter.pojo._
import org.apache.streams.twitter.provider._

val timeline_buf = scala.collection.mutable.ArrayBuffer.empty[Object]
val typesafe = ConfigFactory.parseString(hocon)
val config = new ComponentConfigurator(classOf[TwitterUserInformationConfiguration]).detectConfiguration(typesafe, "twitter");

val provider = new TwitterTimelineProvider(config);
provider.prepare(null)
provider.startStream()

while(provider.isRunning()) {
val resultSet = provider.readCurrent()
resultSet.size()
val iterator = resultSet.iterator();
while(iterator.hasNext()) {
val datum = iterator.next();
//println(datum.getDocument)
timeline_buf += datum.getDocument
}
}
Transforming Tweets into Activity Stream Objects
This is only a few lines of fairly self evident code. We create an ActivityConverterProcessor() and call the prepare method.
Recall, our timeline_buf was an ArrayBuffer of tweets- we are going to map each tweet into a StreamsDatum, because that is the format the converter expects for input. You can see on the next line our converter processes StreamsDatums.
The net result of this block is a scala.collection.mutable.ArrayBuffer[org.apache.streams.pojo.json.Activity] called activity_datums.
%spark

import org.apache.streams.converter.ActivityConverterProcessor
import org.apache.streams.core.StreamsProcessor
import org.apache.streams.pojo.json.Activity
import scala.collection.JavaConverters
import scala.collection.JavaConversions._

val converter = new ActivityConverterProcessor()
converter.prepare()

val status_datums = timeline_buf.map(x => new StreamsDatum(x))
val activity_datums = status_datums.flatMap(x => converter.process(x)).map(x => x.getDocument.asInstanceOf[Activity])
Step 5. Visualizing the results
This is more of a Spark / Apache Zeppelin trick than anything else. The StreamsJacksonMapper converts an Activity Stream Object into a JSON. We create activitiesRDD as an org.apache.spark.rdd.RDD[String] and in the next two lines create a DataFrame and register it as a temp table, in the usual ways.
%spark
import org.apache.streams.jackson.StreamsJacksonMapper;

val mapper = StreamsJacksonMapper.getInstance();
val activitiesRDD = sc.parallelize(activity_datums.map(o => mapper.writeValueAsString(o)))

val activitiesDF = sqlContext.read.json(activitiesRDD)

activitiesDF.registerTempTable("activities")
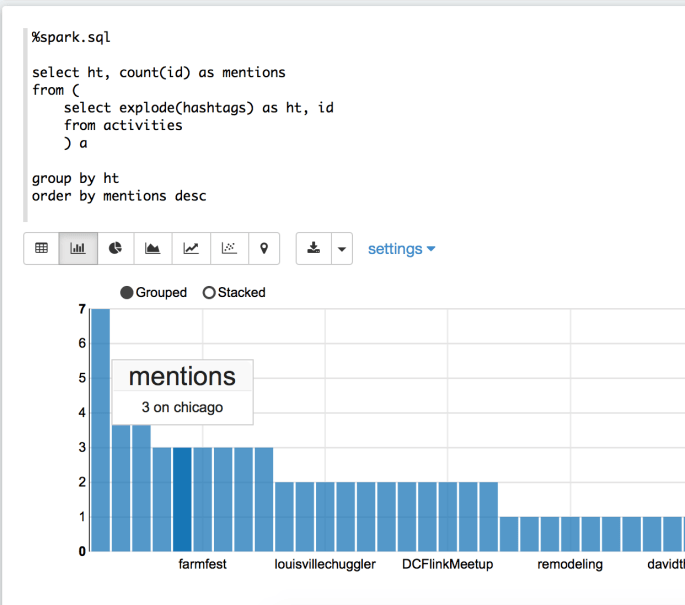
Zeppelin is so fun, because now we can use regular SQL in the next paragraph to explore this table- try this one on for size:
%spark.sql
select ht, count(id) as mentions
from (
select explode(hashtags) as ht, id
from activities
) a

group by ht
order by mentions desc
This query gives us a county by hashtag. There are two thing you’ll want to review regarding SparkSQL and querying JSONs.
– explode a row is with an array of length N it turned into N new rows, one for each element in N.
– To query a nested column use the style super_col.nested_col
Apache Streams is an exciting young project that has the opportunity to really do some good in the world, by way of reducing wasteful redundancy (everyone has to write their own methods for collecting and homogenizing social media data).
Now you may be thinking- that was a lot of extra work to collect and visualize some tweets. I say to you:
1 – It wasn’t that much extra work
2 – Your tweets are now in Activity Streams which can be easily combined with Facebook / YouTube / GooglePlus / etc. data.
Hopefully this is going to be the first in a series of blog posts that will build on each other. Future blog posts will show how to connect other service providers and eventually we will build a collection of tools for collecting and analyzing data about your own social foot print. The series will culminate in a collection of Zeppelin Notebooks that allow the use to build an entire UI backed by Streams.
In this post we’re going to really show off the coolest (imho) use-case of Apache Mahout – roll your own distributed algorithms.
All of these posts are meant for you to follow-along at home, and it is entirely possible, you don’t have access to a large YARN cluster. That’s OK. Short story- they’re free on IBM’s BlueMix, where you can:
1. Sign up for a free 30-day account
2. Setup a 5-Node BigInsights (IBMs Hadoop Distro) on Cloud
3. Install Apache Zeppelin and Apache Mahout
4. Run an absurdly large OLS algorithm
The benefit of using a Hadoop as a Service environment is that for analytics, our dataset might not be HUGE enough that uploading is prohibitive, but big enough that we need more horse power than a single node can provide. Being able to spool up a cluster, upload a few files, do some work on it with 5 nodes/240GB RAM/ 48 Virtual processors- and then throw the environment away has a lot of use cases.
In this post we’re doing to write an Ordinary Least Squares algorithm, and then run it on a dataset of 100 million observations by 100 columns (dense).
This is a simplest of algorithms to get you started. Once you have this power at your finger tips, implement any algorithm you find specified in matrix form (which is most of them in academic papers) in Spark or Flink with ease. No longer are you tied to what ever the powers that be running SparkML and FlinkML decide to implement!
Disclosure: I’m working for IBM now, this isn’t an unsolicited sales pitch. The notebook available for part 4 will be available and will run on any Zeppelin instance (assuming you’ve followed the directions for setting up Mahout on Apache Spark listed in a previous post). If you are running Zeppelin locally, you also won’t be able to go as big as we do.
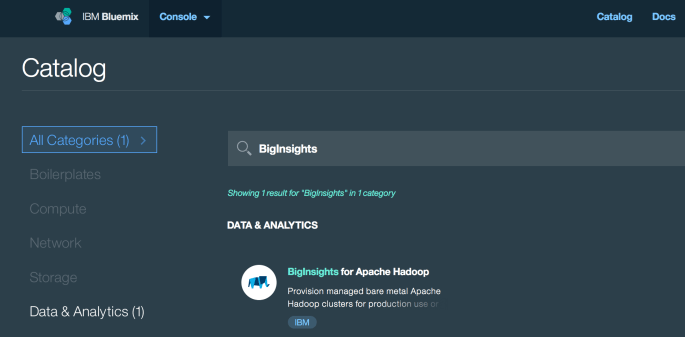
Log in to BlueMix. In the navigation bar you should see “Catalog”. Click that, and then search “BigInsights”.
There are a few different UIs floating around at the moment, if you can’t find a way to create BigInsights, this link might help (must be logged in).Link
Click on BigInsights. In the next window, there should be a button that says ‘Create’ somewhere towards the right or bottom-right. (Old vs. new UI). From this point on, everything should look the same, so I’ll post more screen shots.
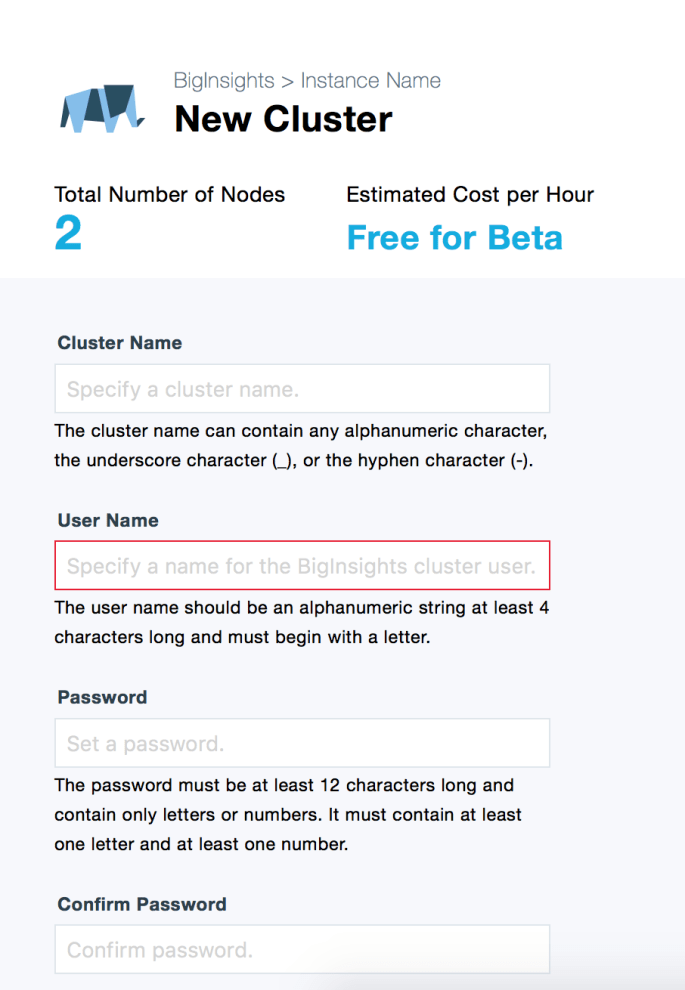
On the next screen click “Open”, and on the screen following that click “New Cluster”.
You should now be at a screen that looks like this:
The cluster name/ username / password don’t really matter.
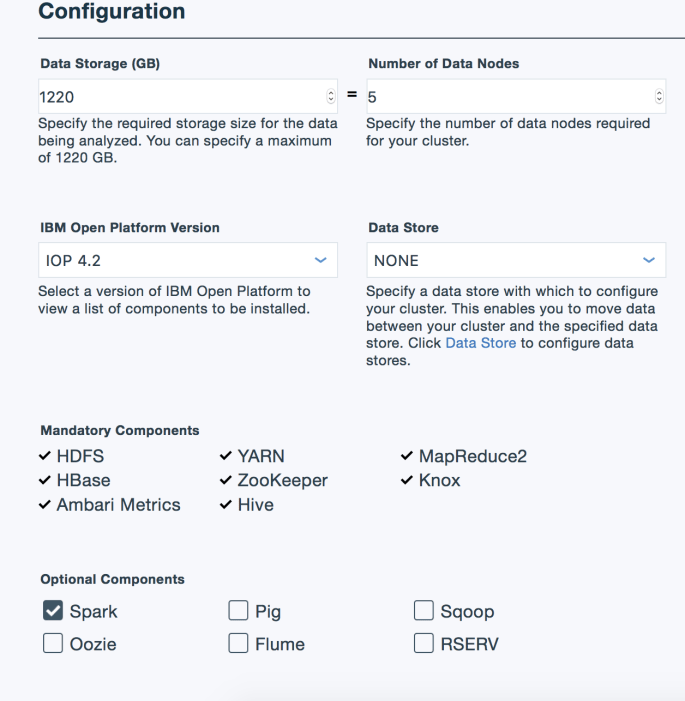
In the following section, make sure to set the following:
Number of Data Nodes: 5 (current max for free users)
IBM Open Platform Version: IOP 4.2 (4.3 has Spark 2.0- gross).
Optional Components: Make sure Spark is checked.
Click “Create” and then go grab some coffee or whatever. It will take about 5-10 minutes to setup.
After you click create you’ll be taken to a screen talking about your cluster.
In the top center you will see SSH Host and a value below that looks something like bi-hadoop-prod-XXXX.bi.services.us-south.bluemix.net, where the XXXX will be four numbers. You will need this value for the next step.
Step 3. Install Apache Zeppelin and Apache Mahout
As a proud new IBM employee, I get unfettered access to these little clusters, to celebrate I’ve done a little Python witchcraft for quickly installing and my favorite services into BigInsights Cloud instances. These scripts also open up some ports in the firewall as needed for WebUIs (especially on Zeppelin, Apache NiFi, and Apache Flink).
The scripts in essence do the following:
– ssh in to the cluster
– download the binaries of the desired program (Zeppelin, NiFi, Flink, etc.)
– untar the program
– Upload some config files specific to BigInsights
– Start the service
– If a WebUI is necessary, a BlueMix app will be created which establishes an ssh tunnel between the world wide web and the port of the service (e.g. 8080 for Zeppelin).
Skip to the end of this section to see what I mean regarding the BlueMix app.
The following assumes you are running on some sort of Ubuntu. The principals are the same, but you might need to take different steps to make this work on CentOS or OSX.
Obviously you need Python.
You also need the Python modules paramiko and scp, which are used for using ssh with Python. To install these in Ubunbu, from the command line run:
– sudo apt-get install python-paramiko
– sudo apt-get install python-scp
Next you will need to install Cloud Foundry and IBM’s Cloud Foundry bonus packs.
In ./bluemix-extra-services you’ll find a script example_zeppelin_mahout.py. Open it up and set the following variables:
– APP_PREFIX : Whatever you set this to, Zeppelin will become available at http://APP_PREFIX-zeppelin.mybluemix.net
– SERVER : The name of the SSH Host from the end of Step 2. (not the name you assigned but the ssh address!)
– USERNAME : Username you entered when you created the server
– PASSWORD : Password you entered when you created the server
Note on S3 notebook repositories
You’ll see some commented out section about S3 notebooks. BigInsights free clusters only persist for 14 days. When they expire- so do all of your notebooks, if not persisted. You can use AWS S3 to persist notebooks so they always pop up when create a new cluster. If you have an AWS account, you can create a bucket, and set S3_BUCKET to that value. In that bucket create a folder, set S3_USERNAME to whatever that folder is called. In that folder, create a folder called notebook. There is a link also commented out that explains this further. A little ways down you will see a line commented out z.setS3auth(S3_USERNAME, S3_BUCKET). Uncomment that line to have the script update the config files to use your S3 bucket at a notebook repository.
Finally, in S3. Click on your name at the top right, there will be a drop down. Click on “Security and Credentials”. A window will pop up, click “Continue …”. In the page in the center, click on “Access Keys (Access Key ID and Secret Access Key)”. Click on the blue button that says, “Create New Access Key”. Click on “Download key file”. Save the file as /path/to/bluemix-extra-services/data/resources/aws/rootkey.csv.
These steps are required. That makes this demo a bit more tedious, but in general is good, because then all your Zeppelin notebooks follow you where ever you go. (In the future I’ll probably update so this isn’t required, I’ll update the post then.)
NOTE on S3 charges Using S3 will incur a cost… My notebooks cost me about 14 cents per month.
The important thing to do before running this script is to make sure your cluster is fully set up. To do this, in the browser tab where you created your cluster, click the little back arrow to get to the Cluster list. You will have one cluster listed, named what ever you named it. It should have a little green circle and say “Active”. If it is a yellow circle and says “Pending”, wait a little longer or hit the refresh button at the top of the list. If it is a red circle and says “Failed” has happened to me about one time in 100, hover over the little gear to the right, click “Delete Cluster”, then create a new one again. If that happens be advised your SSH Host will have changed.
Once the cluster is active and you have updated and saved the Python script, run it- it will give you some standard out that should end in
webapp should be available soon at `http://APP_PREFIX-zeppelin.mybluemix.net
where APP_PREFIX is whatever you described it as.
This script is downloading various packages, uploading config files, and finally starting a simple python web app that establishes an SSH tunnel from the webapp to the webUI of the service on the BigInsights cloud cluster.
So you’ve made it this far, eh? Well done. Crack a beer- the rest is pretty easy. Apache Mahout is a library that allows you to quickly ‘roll your own’ algorithms based on matrix representations, and run them on your favorite distributed engine (assuming that engine is either Apache Spark, Apache Flink, or H20).
Now- we’re assuming you followed Step 3. to create a YARN cluster, and as such you have a Spark interpreter with all of the appropriate Mahout dependencies and settings. If you didn’t follow step 3, that’s ok- just make sure to create the Mahout interpreter following the steps found in this previous post.
The first paragraph you need to run when using the Mahout interpreter in Zeppelin imports Mahout and sets the distributed context.
The example we are going to do today very closely follows the Playing With the Mahout Shell post from the Mahout website, except with a twist. In our version we are going to use import org.apache.spark.mllib.util.LinearDataGenerator to create a very large data set to crunch.
Synthesize some Linear Data
%sparkMahout

import org.apache.spark.mllib.util.LinearDataGenerator
val n = 100000000
val features = 100
val eps = 0.1 // i'm guessing error term, poorly documented
val partitions = 5500
val intercept = 10.0

val synDataRDD = LinearDataGenerator.generateLinearRDD(sc, n, features, eps, partitions, intercept)
Now we have a very large dataset, we need to convert it into a Mahout Distribute Row Matrix (think the Mahout equivelent of a RDD). A good primer on Mahout can be found here.
Create DRM from RDD
%sparkMahout
val tempRDD = synDataRDD.zipWithIndex.map( lv => {
val K = lv._2.toInt
val x = new DenseVector(lv._1.features.toArray )
//x = sparkVec2mahoutVec( lv._1.features ) // still doesn't serialize
val y = lv._1.label
(K, (y, x))
}).persist

println("----------- Creating DRMs --------------")
// temp RDD to X an y
val drmRddX:DrmRdd[Int] = tempRDD.map(o => (o._1, o._2._2))
val drmX = drmWrap(rdd= drmRddX)
val drmRddY:DrmRdd[Int] = tempRDD.map(o => (o._1, new DenseVector( Array(o._2._1) )))
val drmy = drmWrap(rdd= drmRddY)
Also note, the only reason we are using Spark instead of Flink here, is that SparkML comes with this nice linear data generator. Assuming you were loading your data from some other source, the following will code will run on Mahout on Spark OR Mahout on Flink.
%sparkMahout
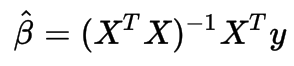
val drmXtX = drmX.t %*% drmX
val drmXty = drmX.t %*% drmy
val beta = solve(drmXtX, drmXty)
And that’s it. An R-Like DSL for Scala that runs inside your Spark code and can be copy-pasted to Flink code.
Play with the paragraph that synthesizes data. This is a good exercise on how Spark partitioning strategies can affect performance. I played with it for an hour or so- 100 million rows by 100 columns was the largest I could get to run on the BigInsights Cloud ( which has approx 240GB RAM and 48 processors ).
In this post we spent a lot of time setting up an environment and not much time doing anything with it. The onus is now on you to go implement algorithms. In posts that follow, I intend to refer back to this post for setting up an environment that has the horse power to calculate big jobs. Because if you’re not going to be distributed then you have to ask your self, why not just do this in R?
tg
When things go wrong.
Two types of errors can happen in general:
– Zeppelin failed to start correctly
– The webapp failed to start
If you go to the address given and see a 404 error (make sure you typed it correctly), odds are the webapp failed. From the dashboard in BlueMix you should see your webapp, click on it and then click on logs. See if there are any clues.
If you go to the address and see a 502 error, Zeppelin didn’t start. Check the standard out from when you ran the program and look for errors.
If you go to the address and see a 503 error, the web app is tunneling correctly, but Zeppelin isn’t serving it data.
In a terminal ssh in to the cluster as follows:
ssh username@ssh-host
where username is the user name you picked in step 2, and ssh-host is the host given in SSH Host.
If you had a 502 error, from here you can manually start Zeppelin with
z*/bin/zeppelin-daemon.sh start
Then try the website again.
The BigInsights cluster is restrictive to say the least. Use tail to see the end of the logs.
tail z*/logs/*out -n 50
Look for something about AWS credentials not being accepted. If that happens, STOP ZEPPELIN
z*/bin/zeppelin-daemon.sh stop
Delete the zeppelin directory
rm -rf zeppelin-0.7.0-SNAPSHOT
Double check the rootkey.csv (maybe re download?) and run the python script again.
If you don’t see anything, at this point it is just standard Zeppelin troubleshooting.
Big Data for n00bsis a new series I’m working on targeted at absolute beginners like my self. The goal is to make some confusing tasks more approachable. The first few posts will be spin offs of a recent talk I gave at Flink Forward 2016 Apache Zeppelin- A Friendlier Way To Flink (will link video when posted).
Graph databases are becoming an increasingly popular way to store and analyze data, especially when relationships can be expressed in terms of objectverbobject. For instance, social networks are usually represented in graphs such as
Jack likes Jills_picture
A full expose on the uses and value of graph databases is beyond the scope of this blog post however the reader is encouraged to follow these links for a more in depth discussion:
Using d3js and Apache Zeppelin to Visualize Graphs
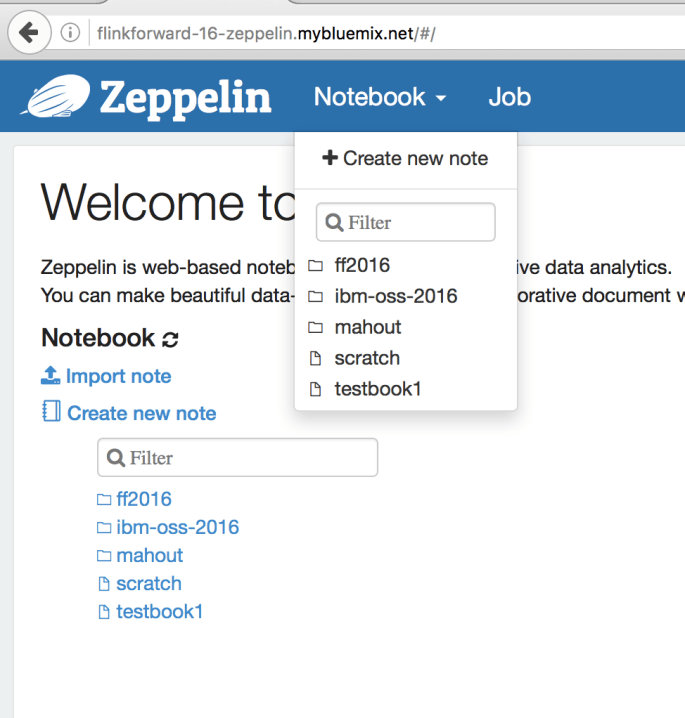
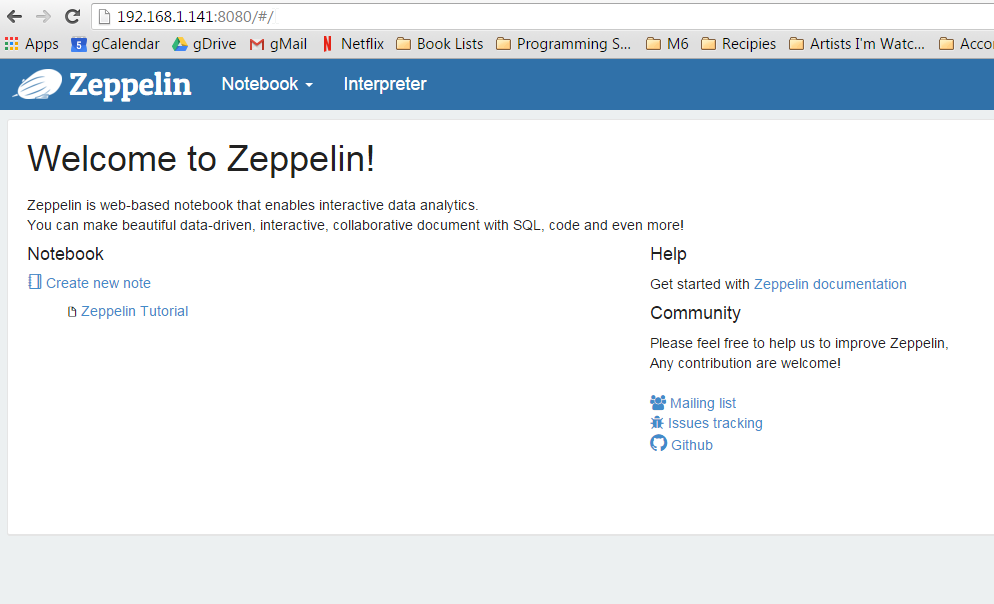
First, download Apache Zeppelin (click the link and choose the binary package with all interpreters) then “install” Zeppelin by unzipping the downloaded file and running bin/zeppelin-daemon.sh start or bin/zeppelin.cmd (depending on if you are using windows or Linux / OSX). See installation instructions here.
You should see a “Welcome to Zeppelin” page. We’re going to create a new notebook by clicking the “Notebook” drop down, and the “+Create new note”.
Call the notebook whatever you like.
Add dependencies to the Flink interpreter
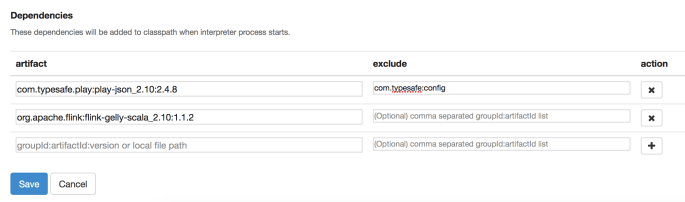
Next we need to add two dependencies to our Flink interpreter. To do this we go to the “Interpreters” page, find the “Flink” interpreter and add the following dependencies:
com.typesafe.play:play-json_2.10:2.4.8
used for reading JSONs
org.apache.flink:flink-gelly-scala_2.10:1.1.2
used for the Flink Gelly library
We’re also going to exclude com.typesafe:config from the typesafe dependency. This packaged tends to cause problems and is not necessary for what we are doing, so we exclude it.
The dependencies section of our new interpreter will look something like this:
Downloading some graph data
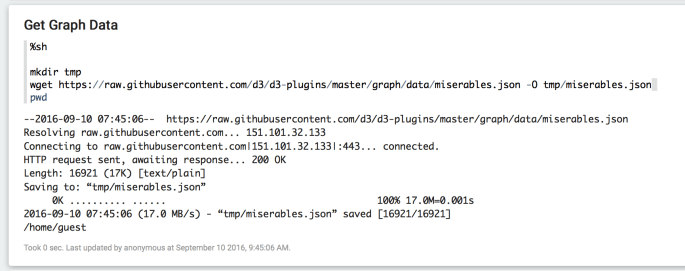
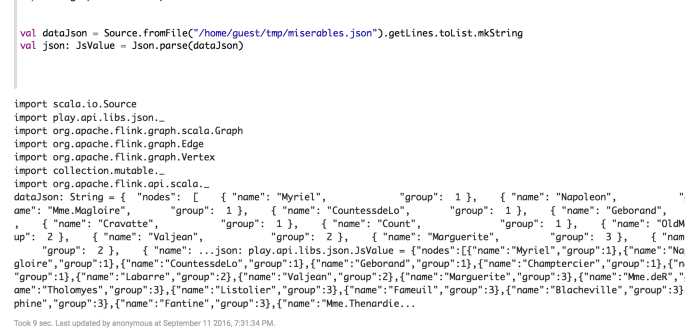
Go back to the notebook we’ve created. In the first paragraph add the following code
%sh

mkdir tmp

wget https://raw.githubusercontent.com/d3/d3-plugins/master/graph/data/miserables.json -O tmp/miserables.json
It should look like this after you run the paragraph (clicking the little “play” button in top right corner of paragraph):
What we’ve done there is use a Linux command wget to download our data. It is also an option to simply download the data your browser, you could for example right click on this link and click “Save As…” but if you do that, you’ll need to edit the next paragraph to load the data from where ever you saved it to.
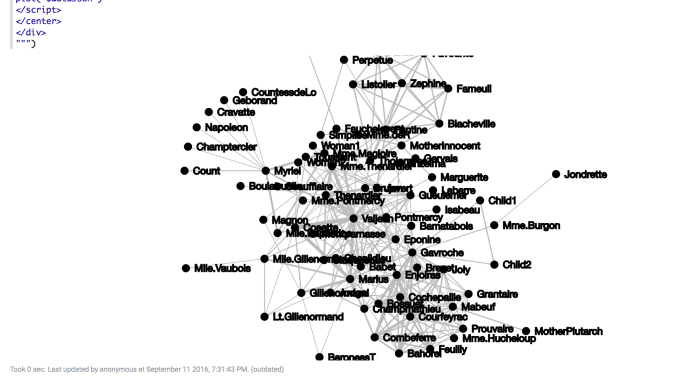
Visualizing Data with d3js
d3js is a Javascript library for making some really cool visualizations. A fairly simple graph visualization was selected to keep this example fairly simple; a good next step would be to try a more advanced visualization.
Now, check out what we just did there: println(s"""%html ... $dataJson. We just created a string that started with the %html tag, letting Zeppelin know, this is going to be a HTML paragraph, render it as such, and then passed the data directly in. If you were to inspect the page you would see the entire json is present in the html code.
This is the (messy) graph we get.
From here, everything is a trivial exercise.
Let’s load this graph data into a Gelly Graph:
val vertexDS = benv.fromCollection(
(json \ "nodes" \\ "name")
.map(_.toString).toArray.zipWithIndex
.map(o => new Vertex(o._2.toLong, o._1)).toList)

val edgeDS = benv.fromCollection(
((json \ "links" \\ "source")
.map(_.toString.toLong) zip (json \ "links" \\ "target")
.map(_.toString.toLong) zip (json \ "links" \\ "value")
.map(_.toString.toDouble))
.map(o => new Edge(o._1._1, o._1._2, o._2)).toList)

val graph = Graph.fromDataSet(vertexDS, edgeDS, benv)
Woah, that looks spooky. But really is not bad. The original JSON contained a list called nodes which held all of our vertices, and a list called links which held all of our edges. We did a little hand waving to parse this into the format expected by Flink to create an edge and vertex DataSet respectively.
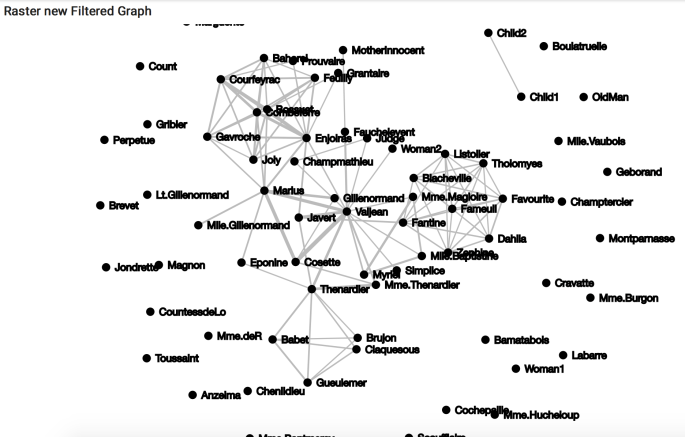
From here, we can do any number of graph operations on this data, and the user is encouraged to do more. For illustration, I will perform the most trivial of tasks: filtering on edges whose value is greater than 2.
val filteredGraph = graph.filterOnEdges(edge => edge.getValue > 2.0)
Now we convert our data back in to a json, and use the same method to re-display the graph. This is probably the most complex operation in the entire post.
As we see we are creating a json string from the edges and vertices of the graph. We call filteredGraph.getVertices.collect() and then map those vertices into the format expected by the json. In this case, our rendering graph expects a list of dictionaries of the format { "name" : }. The edges follow a similar pattern. In summation though we are simply mapping a list of of collected vertices/edges to string representations in a json format.
Finally, we repeat our above procedure for rendering this new json. An imporant thing to note, our code for mapping the graph to the json will work for this no matter what operations we perform on the graph. That is to say, we spend a little time setting things up, from a perspective of translating our graphs to jsons and rendering our jsons with d3js, and then we can play as much as we want with our graphs.
Also note we have changed $dataJson to $jsonOutStr as our new graph is contained in this new string.
A final important call out is the d3.select("#foo2") and <div id="foo2"> in the html string. This is creating a container for the element, and then telling d3js where to render the element. This was the hardest part for me; before I figured this out, the graphs kept rendering on the grey background behind the notebooks- which is cool, if that’s what you’re going for (custom Zeppelin skins anyone?), but very upsetting if it is not what you want.
New filtered graph.
Conclusions
Apache Zeppelin is a rare combination of easy and powerful. Simple things like getting started with Apache Flink and the Gelly graph library are fairly simple, however we are still able to add in powerful features such as d3js visualizations, with relatively little work.
I was at Apache Big Data last week and got to talking to some of the good folks at the Apache Mahout project. For those who aren’t familiar, Apache Mahout is a rich Machine Learning and Linear Algebra Library that originally ran on top of Apache Hadoop, and as of recently runs on top of Apache Flink and Apache Spark. It runs in the interactive Scala shell but exposes a domain specific language that makes it feel much more like R than Scala.
Well, the Apache Mahout folks had been wanting to build out some visualization capabilities comparable to matplotlib and ggplot2 (Python and R respectively). They had considered integrating with Apache Zeppelin and utilizing the AngularJS framework native to Zeppelin. We talked it out, and decided it made much more sense to simply usethe matplotlib and ggplot2 features of Python and R, and Apache Zeppelin could to facilitate that somewhat cumbersome pipeline.
So I dinked around with it Monday and Tuesday, learning my way around Apache Mahout, and overcoming an issue with an upgrade I made when I rebuilt Zeppelin (in short I needed to refresh my browser cache…).
Without further ado, here is a guide on how to get started playing with Apache Mahout yourself!
Step 1. Clone / Build Apache Mahout
At the bash shell (e.g. command prompt, see my other blog post on setting up Zeppelin + Flink + Spark), enter the following:
git clone https://github.com/apache/mahout.git
cd mahout
mvn clean install -DskipTests
That will install Apache Mahout.
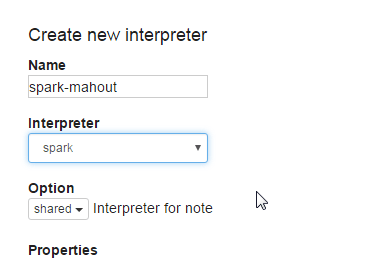
Step 2. Create/Configure/Bind New Zeppelin Interpreter
Make sure to click ‘Save’ when you are done. Also, maybe this goes without saying, maybe it doesn’t… but
make sure to change username to your actual username, don’t just copy and paste!
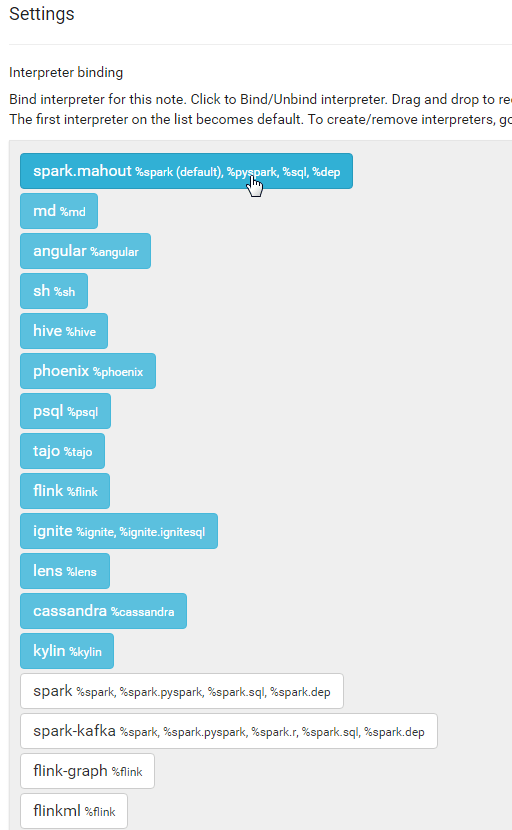
Step 2c. Bind
In any notebook in which you want to use the spark-mahout interpreter, not the regular old Spark one, you need to bind correct interpreter.
Create a new notebook, lets call it “[MAHOUT] Binding Example”.
In the top right, you’ll see a little black gear, click on it. A number of interpreters will pop up. You want to click on the Spark one at the top (such that is becomes un-highlighted) then click on the “spark-mahout” one toward the bottom. Finally drag the “spark-mahout” one up to the top. Finally, as always, click on ‘Save’.
Now, this notebook knows to use the spark-mahout interpreter instead of the regular spark interpreter (and so, all of the properties and dependencies you’ve added will also be used). You’ll need to do this for every notebook in which you wish to use the Mahout Interpreter!
Step 2d. Setting the Environment
Back at the command prompt, we need to tweek the environment a bit. At the command prompt (assuming you are in the mahout directory still):
./bin/mahout-load-spark-env.sh
And then we’re going to export some environment variables:
export MAHOUT_HOME=[directory into which you checked out Mahout]
export SPARK_HOME=[directory where you unpacked Spark]
export MASTER=[url of the Spark master]
If you are going to be using Mahout often, it would be wise to add those exports to $ZEPPELIN_HOME/conf/zeppelin-env.sh so they are loaded every time.
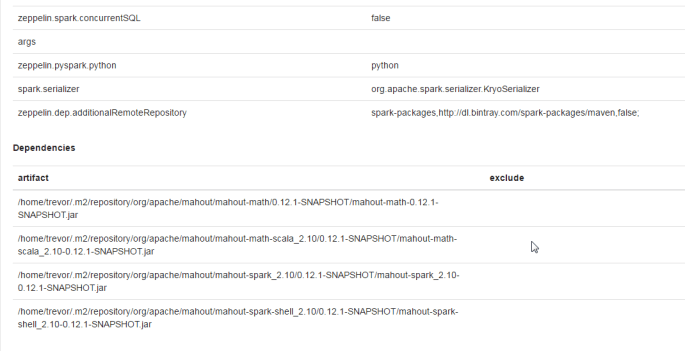
I’m going to do you another favor. Go to the Zeppelin home page and click on ‘Import Note’. When given the option between URL and json, click on URL and enter the following link:
That is where the magic happens and introduces Mahout’s SparkDistributedContext and the R-like Domain Specific Language.
You know how in Scala you can pretty much just write whatever you want (syntactic sugar run-amok) well a domain specific language (or DSL) lets you take that even further and change the syntax even further. This is not a precisely accurate statement, feel free to google if you want to know more.
The moral of the story is: what was Scala, now smells much more like R.
Further, for the rest of this notebook, you can now use the Mahout DSL, which is nice because it is the same for Flink and Spark. What that means is you can start playing with this right away using Spark-Mahout, but when the Flink-Mahout comes online soon (and I promise to update this post showing how to hook it up) you can copy/paste your code to your Flink-Mahout paragraphs and probably run it a bunch faster.
The Main Event
So the whole point of all of this madness was to monkey-patch Mahout into R/Python to take advantage of those graphics libraries.
UPDATE 5-29-16: Originally, I had accidentally re-linked the first notebook (sloppy copy-paste on my part)- this one shows ggplot2 integration, e.g. the entire point of this Blog post…
Ignore the first couple of paragraphs (by the time you read this I might have (unlikely, lol) cleaned this notebook up and deleted).
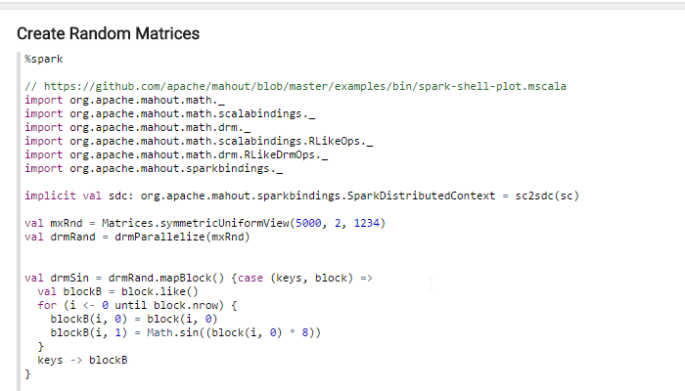
There is a paragraph that Creates Random Matrices
…yawn. You can grok it later. But again, notice those imports and creating the SparkDistributedContext. We’re using our SparkContext (sc ) that Zeppelin automatically creates in the paragraph to initialize this.
In the next paragraph we sample 1000 rows from the matrix. Why a sample? Well in theory the whole point of using Mahout is you’re going to be working with matrices much to big to fit in the memory of a single machine, much less graph them in any sort of meaningful way (think millions to trillions to bajillions of rows). How many do you really need. If you want to get a feel for the matrix as a whole, random sample. Depending on what you’re trying to do will determine how exactly you sample the matrix, just be advised- it is a nasty habit to think you are just going to visualize the whole thing (even though it is possible on these trivial examples). If that were possible in the first place on your real data, you’d have actually been better served to just used R to begin with…
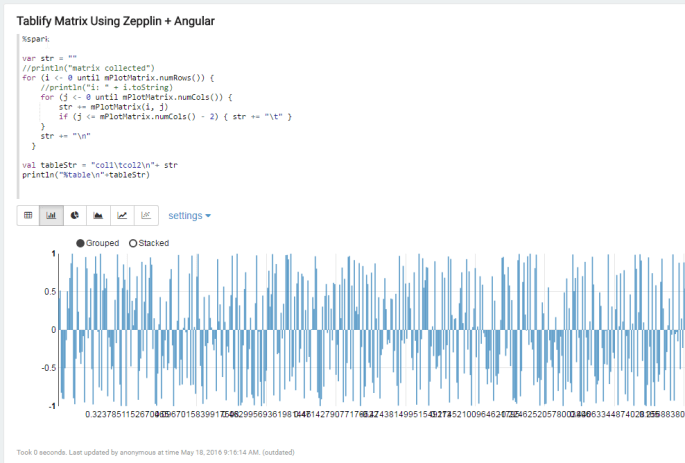
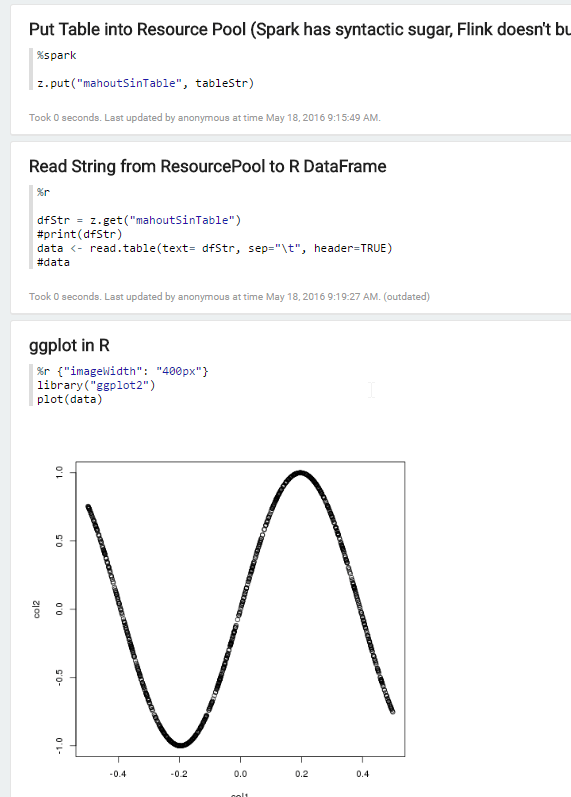
The next paragraph basically converts the matrix into a tab-separated-file, except it is held as a string and never actually written to disk. This loop is effective, but not ideal. In the near future we hope to wrap some syntactic sugar around this, simply exposing a method on the matrix that spits out a sampled *.tsv. Once there exists a tab-separated string, we can add %table to the front of the string and print it- Zeppelin will automatically figure out this is supposed to be charted and you can see here how we could use Zeppelin’s predefined charts to explore this table.
Keeping in mind this matrix was a sine function, this sampling looks more or less accurate. The Zeppelin graph is trying to take some liberties though and do aggregations on one of the columns. To be fair, we’re trying to do something weird here; something for which this chart wasn’t intended for.
Next, the tsv string is then stored in something known to Zeppelin as the ResourcePool. Almost any interpreter can access the resource pool and it is a great way to share data between interpreters.
Once we have a *.tsv in memory, and it’s in the resource pool, all that is left is to “fish it out” of the resource pool and load it as a dataframe. That is an uncommon but not altogether unheard of thing to do in R via the read.table function.
Thanks to all of the work done on the SparkR-Zeppelin integration, we can now load our dataframe and simply use ggplot2 or a host of other R plotting packages (see the R tutorial).
A post thought
Another way to skin this cat would be to simply convert the Mahout Matrix to an RDD and then register it as a DataFrame in Spark. That is correct, however the point of Mahout is to be engine agnostic, and as Flink is mainly focused on streaming data and not building out Python and R extensions, it is unlikely a similar functionality would be exposed there.
However, you’re through the looking-glass now, and if doing the distributed row matrix -> resilient distributed data set -> Spark data frame -> read in R makes more sense to you/your use case, go nuts. Write a blog of your own and link back to me 😉
UPDATE 5-23: The world and ecosystem of Big Data evolves quickly. Most of these tools have gone through multiple releases since I first penned this article. I’ve tried to update accordingly. Good hunting.
That title is a lie, probably.
Spark is the hot new thing in big data. Flink will be the hot new thing in big data as internet-of-things, real-time analytics, and other buzz-words go from being stary-eyed promises made in sales pitches to things that actually happen. At the end of the day, most people don’t want to get their hands dirty monkeying around with the mechanics of this stuff, they just want a pretty web interface to use.
So to get paid a gagillion dollars, you basically just start tinkering with this and maybe contribute a bit here and there, then in 2 years when Flink and Spark are the new Microsoft Excel, you’re one of a couple thousand people in the world who have been working with this stuff for over a year. #!/bin/sh (pronounced ‘sha-bang’, more computer jokes, I digress) you’re getting paid a gagillion a year.
Let’s be real. Your proposed analytics stack could do some sci-fi black-magic analytics that perfectly predicts all of your KPIs, lottery numbers, and what color of ChuckTs you should rock with that awesome new dinosaur sweater you just got, but if it doesn’t have a sparkly, friendly, not-scary front-end you’re going to have a hard time getting any traction with it. (If you’re not doing this sort of thing day-to-day, then I’m sorry to say, this is the reality of things: people are inherently uncomfortable with submitting jobs via command line.)
Use Case #2: Having a pretty front end for your Spark / Flink like DataArtisans or DataBricks is nice, but for whatever reason you can’t put your data out on some cloud.
Because that one time that this happened…
So with out further ado, I present a nice recipe for setting up Apache Flink, Apache Spark, and Apache Zeppelin(incubating) in big-boy mode. (big-boy mode: Zeppelin comes pre-packaged with Flink and Spark, but you want to be pointing at full blown clusters of both of these because, y’know, science).
But really, this is a heavily documented (over documented?) recipe. It assumes no familiarity with linux and provides little blurbs and links about what each command is doing. I am an autodidact when it comes to computers and while blindly following recipes is nice for getting something going it doesn’t teach you much and if the slightest thing goes wrong you are totally lost. So proceed with no fear.
Step 0:
Because jebus-only-knows what kind of wierd-o setup any given box could have, I present this recipe on a fishbone (that is minimal install) Ubuntu Server 14.04.3 virtual machine. For demo purposes, this minimizes instances where
something weird is causing unique problems and
I miss a dependency because I have it on my computer, but you may not.
There are lots of tutorials on how to install Ubuntu on a virtual machine, but to be honest, if this step scares you, you should plan on this being a full day project or more. It’s really nothing more than a recipe, but you’re going to be doing a lot of learning along the way.
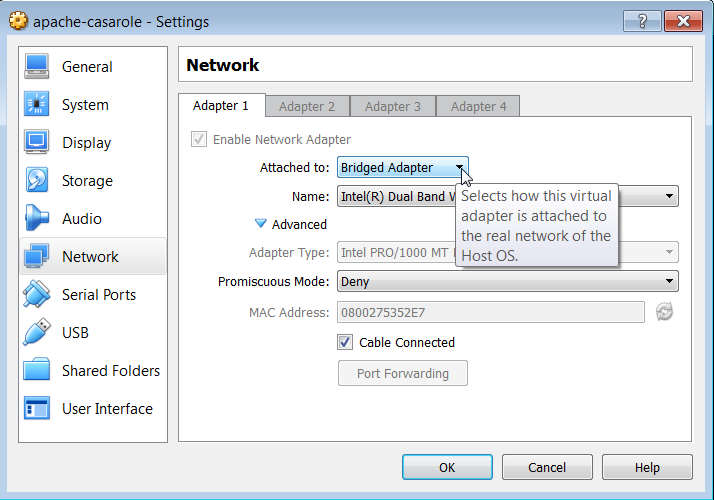
Make sure to setup the virtual box to use a bridged network adapter. A good write up on the differences can be found here. In short, in Oracle VirtualBox go in to the machine Settings -> Networking and select Bridged Adapter from the drop down.
Select Bridged Adapter from the drop down menu.
A bridged adapter basically has the fewest restrictions on the virtual machine. We’re going to be installing a lot of things that will be accessing ports on the host machine and this is just going to be a lot simple. If you’re curious go read more.
Gotchya
Throughout this tutorial I’ll point out things that seem trivial but if you variate from the script even slightly can totally derail you. I do this because I am not one to carefully follow directions and provide this information for others like me. In this case, the ‘gotchya’ is if the virtual machine is already running when you change this setting you need to restart the machine for the changes to take affect.
I only attest to this recipe working on a bare bones Ubuntu 14.04.3 Server installation (the link to exactly what I used is in the ingredients). If you decide to use another version of Ubuntu or flavor of Linux, you may have to tweak some things. Zeppelin, Flink, and Spark are all written in Java/Scala so theoretically this could be done on OSX or Windows, but you wouldn’t run a cluster on Windows or OSX boxes, and for a number of other reasons, I’ve chosen Ubuntu 14.04.3. Get this working then try to do something weird if you want.
Step 1- Prepping the Box
Some basic applications that will be required by the programs we are going to use. Software in Ubuntu is managed via apt. Generally speaking there are three ways to get software.
Download from the repository
Download binaries directly
Download and compile from source
In this episode, we’ll be doing all three. If you’re coming from windows and used to everything being pre-compiled for you with a nice pretty GUI installer… I don’t know what to tell you, other than ‘Welcome to Linux, this is life now.’
Any time you see the sudo apt-get we are telling the computer:
sudo literally: super user do
apt-get install use the package manager to install the requested software.
So we are using apt-get to install:
git
git is a program for software version control. We’ll be using to download the latest source code for programs we’re going to compile.
But Maven 3+ isn’t in the repository at the time of this writing. That is to say, if we use apt-get we will get a version of maven that is to old for what we need. So for maven, we are going to download a binary distribution and manually copy it into place.
Maven 3.1+
In the same way apt-get is a neat way to manage software which is kept in a repository, maven manages code libraries for us. Check out https://maven.apache.org/ for more info.
If you already have maven installed, we can use apt to remove software as well as install it.
sudo apt-get purge maven maven2
*note if you don’t have maven installed, this command isn’t going to hurt anything, you’re just going to see an error message about how there was nothing to uninstall.
At the time this article went to press, the main branch of Zeppelin didn’t have support for Flink 0.10 (which at the time of press was the current stable release of Flink). There is a discussion here, but the short version is you either need to hack Zeppelin yourself or use Till Rohrmann’s branch. For parsimony, I present the second method and leave ‘How to hack out Zeppelin’ as content for another post…
First, git clone Apache Zeppelin. This is the third method of getting software discussed earlier. We’re downloading source code to compile.
UPDATE 5-23: Originally we wanted to get Flink v0.10 and Till’s branch had this, now the real Zeppelin is updated to branch 1.0, so we got to the (real) source.
change directory (cd) to incubator-zeppelin
cd incubator-zeppelin
A git can have multiple branches. A good overview is here. We want to checkout the branch that Till made with the Zeppelin configuration for flink-0.10-SNAPSHOT.
git checkout flink-0.10-SNAPSHOT
Now we instruct maven (mvn) to clean and package the source found in the directory (more on maven build life-cycles). Additionally we pass flags to maven instructing it to build against Spark version 1.5 (-Pspark-1.5) and to skip the tests that make sure it compiled correctly. See Gotchya below.
UPDATE 5-23: This all seems to be working now. We add flags -Psparkr -Ppyspark -Pspark-1.6 to make Zeppelin build against Spark 1.6 (included since last time), add support for SparkR and support for pyspark. At the time of writing -Dflink.version=1.0 isn’t necessary, but will hopefully keep this working for a little while longer, especially after Flink v1.1 is released.
I explicitly didn’t use the -Pspark-1.5 flag. If I had, it would have built Zeppelin with an internal Spark interpreter at version 1.5. I was having all sorts of issues when doing this, and finally rolled back to make this a simple-as-possible case. If you want to try your hand at Spark 1.5, then add that flag and in the next section when you install Spark, checkout version 1.5 instead.
The maven build will take a little while (26 minutes for me). When it is done, you should see a message saying BUILD SUCEESS and some statistics.
And finally…drumroll… the moment you’ve all been waiting for … start the Zeppelin daemon.
sudo bin/zeppelin-daemon.sh start
Gotchya
You must use sudo when you start the zeppelin deamon. The onus is on you to remember to do this. It is absolutely possible to start the daemon without sudo and you will be able to run the Flink example listed below, however the Spark example won’t work. The Zeppelin internal Spark interpreter needs super user privileges for creating databases and other various writes.
UPDATE 5-23: Don’t use sudo . If you do it once, you’ll have to do it always, and having Zeppelin running as super user is unwise and unnecessary.
Test flight of our new Zeppelin…
First determine the local IP address of the machine hosting Zeppelin.
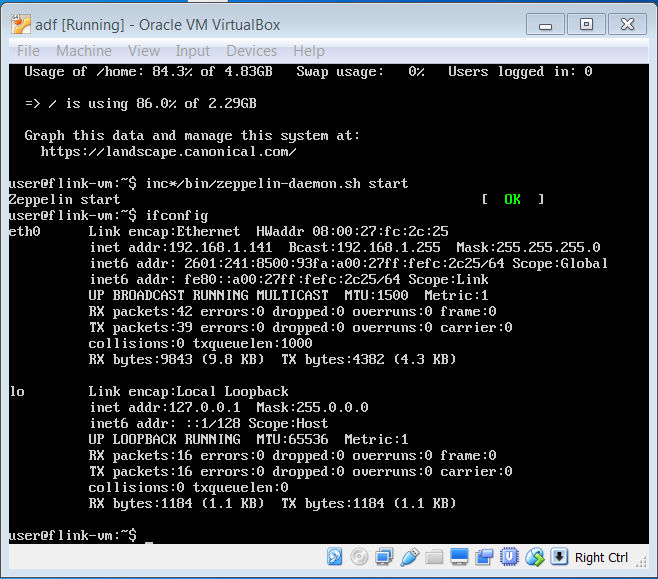
ifconfig
This is the output from my machine, your numbers will be different.
See that the IP of my machine is 192.168.1.109, yours will be different. In subsequent screenshots, in the browser address you will see this IP, however for those following along at home, you need to use your own IP address.
Open a browser and surf to http://yourip:8080, where yourip is the IP you found in the inet addr: field under the eth0 section. Port 8080 is the default port of the Zeppelin WebUI.
Guten Tag, Zeppelin.
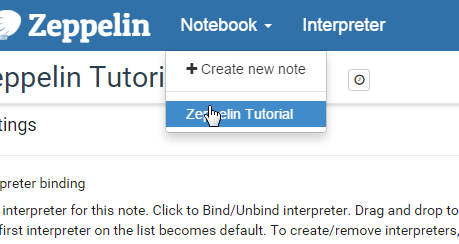
Open the Tutorial Notebook by clicking on Notebook -> Zeppelin Tutorial
Do this.
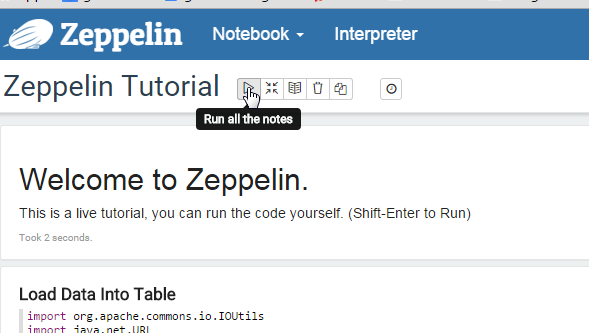
When you open the tutorial notebook it will ask you to bind the interpreters, just do it by clicking save. Now run all of the examples in the notebook to make sure they are working. You can do this by going to each cell and clicking Shift+Enter or by clicking the little play button at the top of the note.
Now we are going to do a couple of simple examples in Flink and Spark. Zeppelin comes pre-built with its own Flink and Spark interpreters, and will use these until we have it pointed at our own cluster (which happens later). For now, we’re going to test some basic functionality of Zeppelin by running a Flink and a Spark word count example against the internal interpreters.
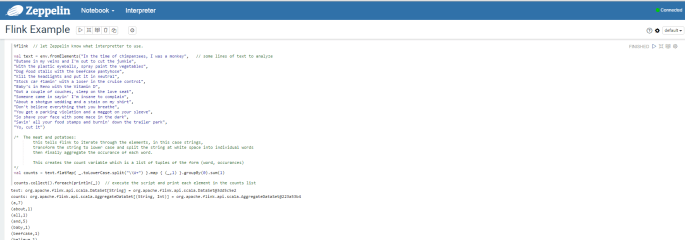
Flink Example
First, create a new notebook. Do this by clicking on Notebook -> Create New Notebook. Name this notebook “flink example”. Zeppelin doesn’t automatically open the notebook you’ve created, you’ll have to click on Notebook again and the name you gave the new notebook will appear in the list.
You can find a Flink word count gist here. Copy and paste the code from the gist into the Zeppelin note and either hit Shift+Enter or click the play button to run the paragraph.
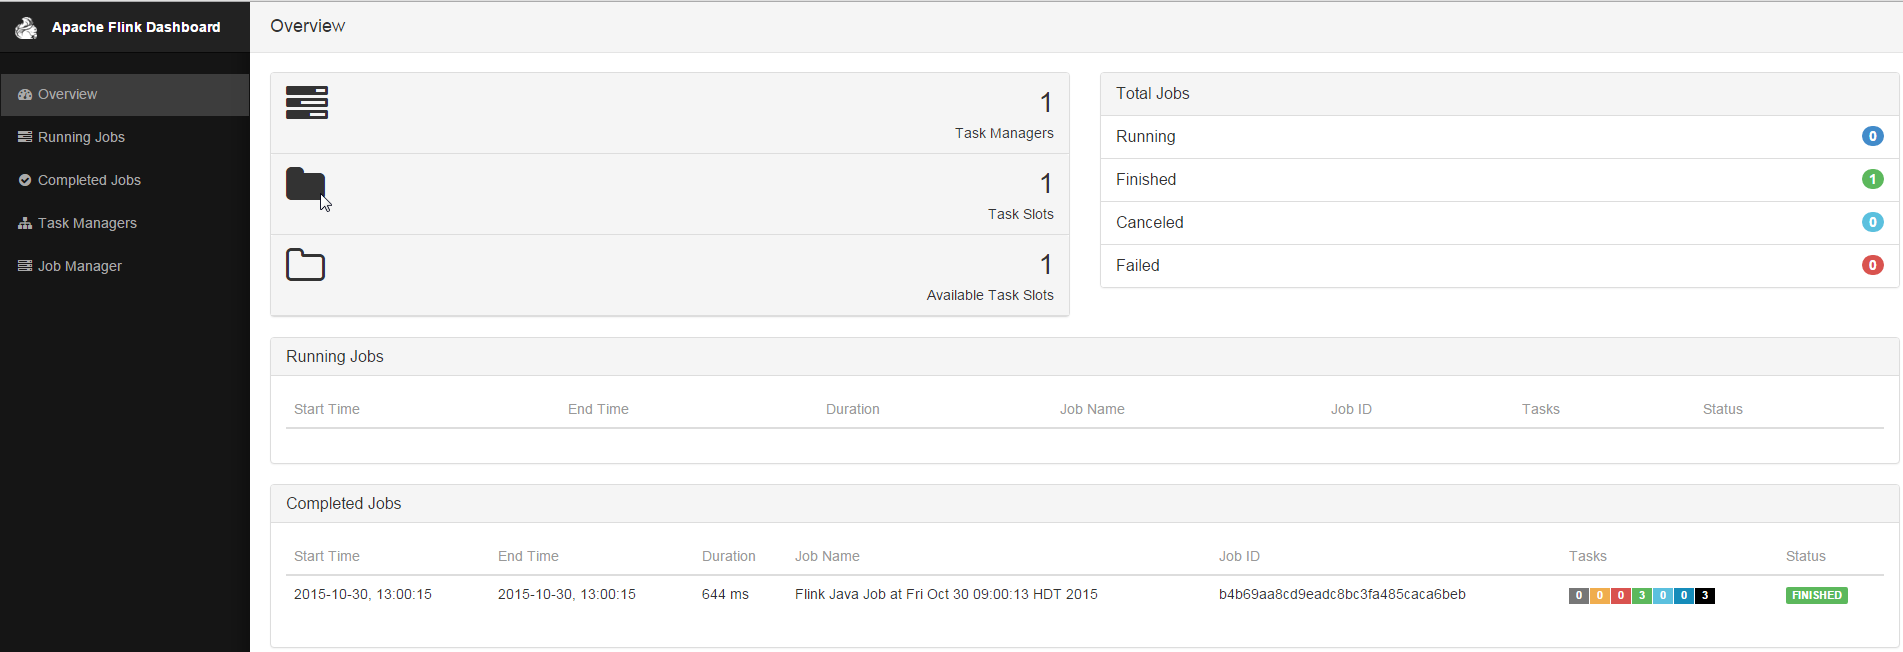
Hopefully you see something like this…
Spark Example
Create another new notebook, call this one “spark example”, and open it.
Assuming your examples are working go ahead and stop Zeppelin.
bin/zeppelin-daemon.sh stop
Installing Flink and Spark Clusters
There are lots of how to guides for getting full blown Flink and Spark clusters set up. For this example, we’re just going to install a stand alone of each. The important thing in this tutorial is how to get Zeppelin aimed at Flink and Spark instances outside of the ones that come prepackaged. These external versions can be scaled/built/setup to suit your use case.
Download, checkout, and start Flink
Download
We change directory back to our home directory
cd $HOME
Then clone the Apache Flink repository
git clone https://github.com/apache/flink.git
Then check out release-0.10 1.0
git checkout release-0.10
git checkout release-1.0
UPDATE 5-23: We’re on release 1.0 now. Release 1.1 (which is what the master branch is on has some cool new stuff like streaming in the shell, but will also break backwards compatibility, e.g. it won’t work). I have a PR that makes it work, but I’ll save that for a future blog post.
And finally, build the package.
mvn clean package -DskipTests
Building Flink took 20 minutes on my virtual box.
Start Flink
Now start Flink with the following command:
build-target/bin/start-cluster.sh
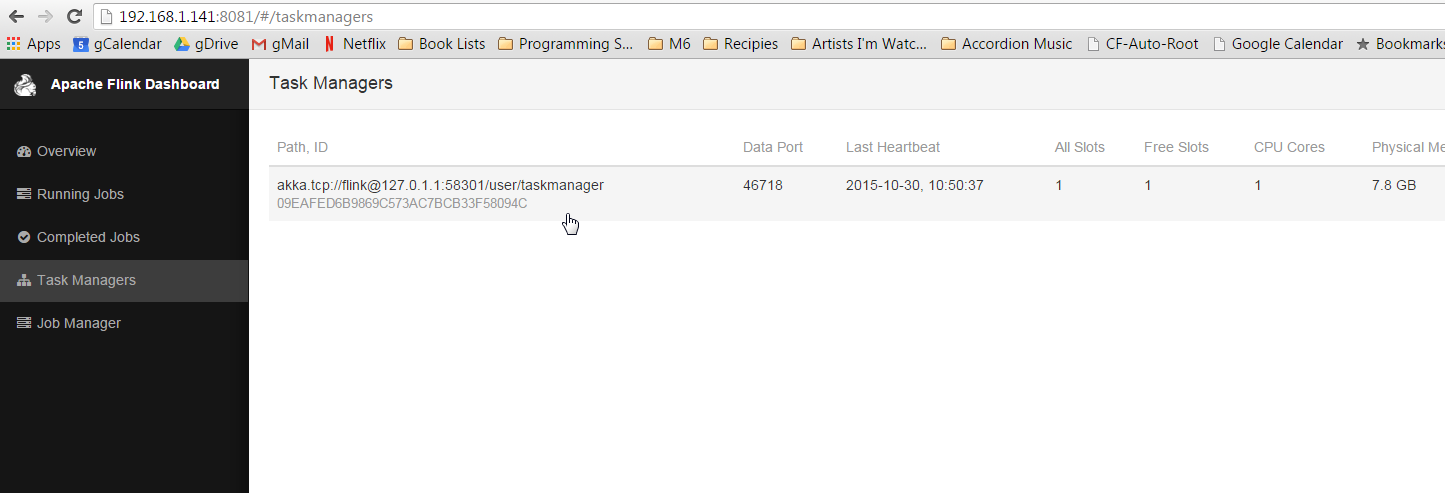
Now go to http://yourip:8081 and check out the Flink web-ui.
Oh, hello there new friend.
Make sure there is something listed under the task manager. If there is nothing stop and restart the flink cluster like this:
UPDATE 5-23: We’re on branch 1.6 now, and we want SparkR support.
And finally, build the package.
mvn clean package -DskipTests
Building Spark took 38 minutes on my virtual box.
Start Spark
In a cluster, you have a boss that is in charge of distributing the work and collecting the results and a worker that is in charge of actually doing the work. In Spark these are referred to as the master and slave respectively.
In Flink we could start an entire stand alone cluster in one line. In Spark, we must start each individually. We start the master with a flag --webui-port 8082. By default the webui-port is 8080, which is already being used by Zeppelin.
sbin/start-master.sh --webui-port 8082
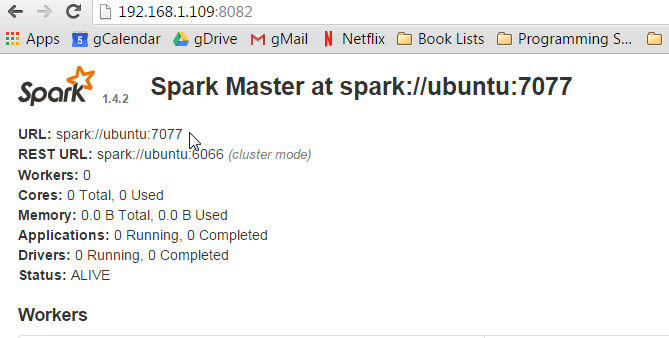
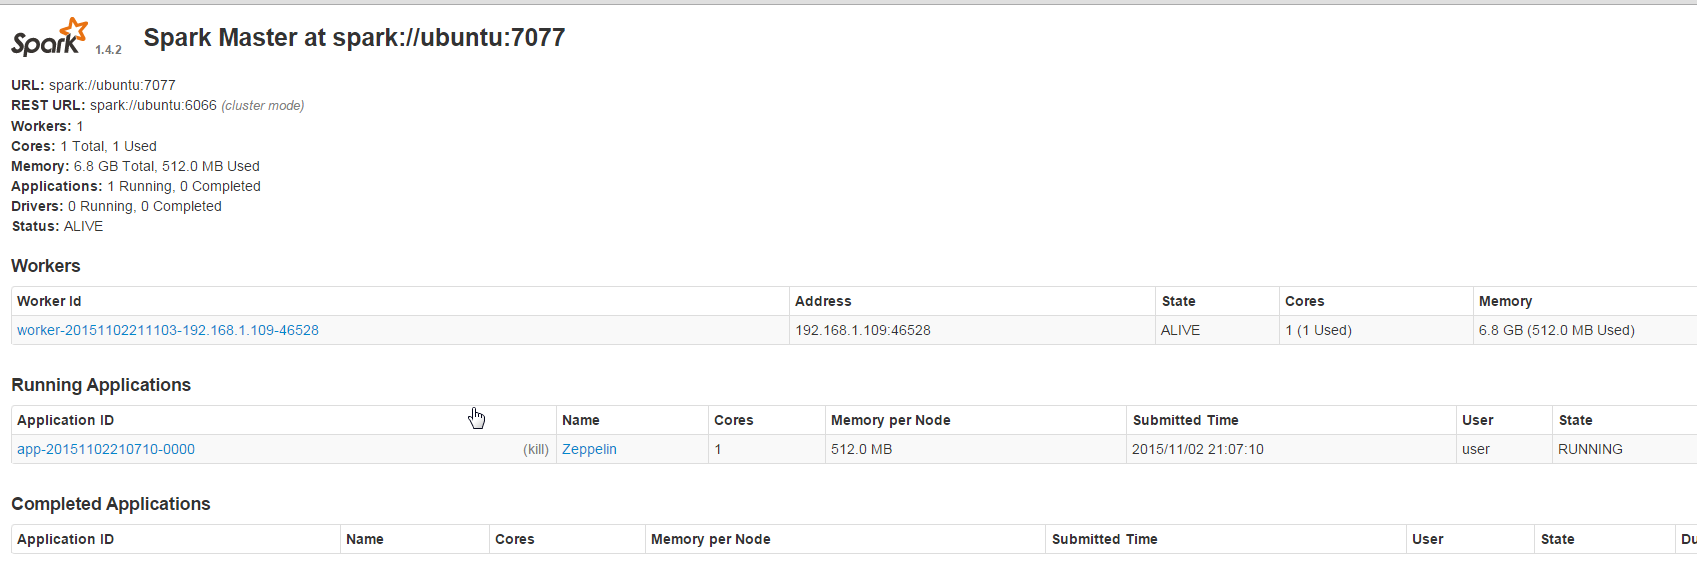
Now go check out the Spark master web-ui. It will be at http://yourip:8082.
Note the URL listed. spark://ubuntu:7077. My URL is ubuntu because that is the name of my host. The name of your host will be what ever you set it up as during install. Write this url down, because next we are starting the slave. We have to tell the slave who its master is.
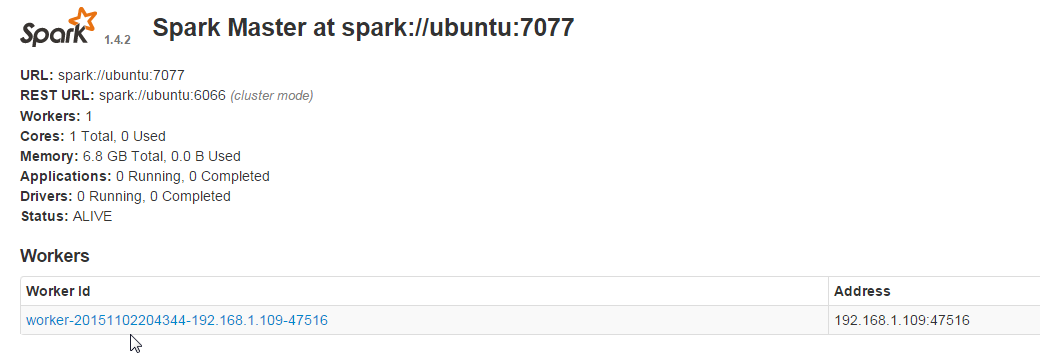
sbin/start-slave.sh spark://yourhostname:7077
The argument spark://yourhostname:7077 lets the slave know who its master is. This is literally the master’s URL. If you have another computer with Spark 1.4 installed you could run this line again (substituting ubuntu for the IP address of the master machine) and add another computer to your cluster.
Gotchya
For those that are not reading carefully and just copying and pasting, you probably won’t see this for a while anyway, but I want to say again, unless you just happen to have named your host ubuntu you need to change that to what ever the name is you found for the Master URL in the Spark Web-UI…
Now go back to your master webui and you should see the slave listed under workers.
Start Zeppelin
Now everything is technically up and running. All we have left to do, is start Zeppelin back up, tell it to run code against our clusters (instead of the internal interpreters), and check that our examples still work.
Start Zeppelin with the following
cd $HOME
incubator-zeppelin/bin/zeppelin-daemon.sh start
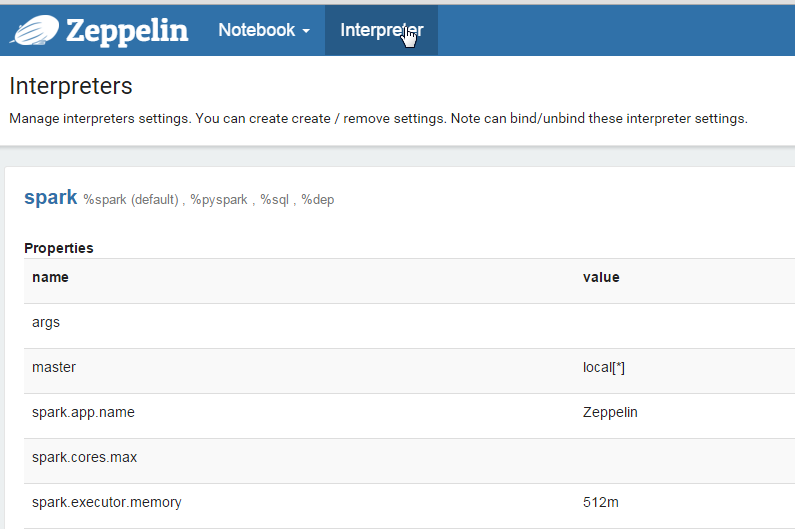
Now go back to the Zeppelin web-ui at http://yourip:8080 and this time click on Interpreters at the top of the screen.
In the Spark section, click the edit button in the top right corner to make the property values editable. The only field that needs to be edited in the Spark interpreter is the master field. Change this value from local[*] to the URL you used to start the slave, mine was spark://ubuntu:7077.
Edit the spark and flink interpreters.
Click ‘Save’, then scroll down to the Flink section. Click ‘edit’ and change the value of host from local to localhost. Click ‘Save’ again.
Now open the Flink notebook we made earlier.
Hit Shift+Enter or hit the play button at the top of the notebook to run the paragraphs. Hopefully the result is the same as before. Now in a new tab, go to the Flink Web-UI at http://yourip:8081. You should see the job has completed successfully on the cluster.
It’s beeeeeautiful!
Now open the spark example notebook from earlier and rerun this as well. After this notebook has run successfully go to the Spark Web-UI at http://yourip:8082 and see the job has run on this cluster.
Is great success.
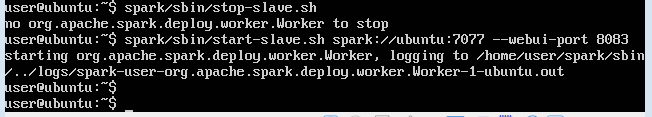
Gotchya
if the Spark job seems to hang, go to the Spark Web-UI. If there is a job listed under running applications, but there are no workers listed, the slave has died, go back to the command line and run
cd $HOME
spark/sbin/start-slave.sh spark://yourhostname:7077
where yourhostname is the hostname you have been using for the Master URL this whole time.
Necromancing the Spark slave.
Summary
Dude (or dudette), crack a beer. You just set up two of the most cutting edge big data engines available today in a cluster mode with an up-and-coming cutting edge (and pretty) web interface. Seriously, not a trivial task. Have you checked your linkedIn inbox in the last hour? because you probably have about 30 recruiters blowing you up.
Seriously though, It took me a couple of days smashing my head against the wall to make this rig work right and consistently. Seeing as I just saved you so much time, I think the least you could do is head over to, and sign up for, and participate in the user mailing lists for
Open source software is a beautiful thing, but it relies on a strong community. All of the projects, (and many more) could use your help, but especially Zeppelin which is still in incubator status.
(A thank you to the wonderful developers wouldn’t hurt either, they watch the mailing lists).
UPDATE 5-23: I let this go with out updates longer than I should have, and I’m sorry. To be honest, I probably won’t do it again. I’m older and wiser now, the things listed here should remain valid for sometime to come. The big changes are: