Let me start off by saying how glad I am to be done with this post series.
I knew when I finished the project, I should have just written all four posts, and then timed them out for delayed release. But I said, “nah, writing blog posts is future-rawkintrevo’s problem and Fuuuuuuug that guy.” So here I am again. Trying to remember the important parts of a thing I did over a month ago, when what I really care about at the moment is Star Trek Bots. But unforuntaly I won’t get to write a blog post on that until I haven’t been working on it for a month too (jk, hopefully next week, though I trained that algorithm over a year ago I think).
OK. So let’s do this quick.
Setting up a K8s On IBM Cloud
Since we were using OpenWhisk earlier- I’m just going to assume you have an IBMCloud account. The bummer is you will now have to give them some money for a K8s cluster. I know it sucks. I had to give them money too (actually I might have done this on a work account, I forget). Anyway, you need to give them money for a 3 cluster “real” thing, because the free ones will no allow Istio ingresses, and we are going to be using those like crazy.
Service Installation Script
If you do anything on computers in life, you should really make a script so next time you can do it in a single command line. Following that them, here’s my (ugly) script. The short outline is :
Install Flink
Install / Expose Elasticsearch
Install / Expose Kibana
Chill out for a while.
Install / Expose my cheap front end from a prior section.
Setup Ingresses.
Upload the big fat jar file.
Flink / Elasticsearch / Kibana
The Tao of Flink On K8s has long been talked about (like since at least last Flink Forward Berlin) and is outlined nicely here. The observant reader will notice I even left a little note to myself in the script. All in all, the Flink + K8s experience was quite pleasant. There is one little kink I did have to hack around, and I will show you now.
Check out this line. The short of the long of it was, the jar we made is a verrrry fat boy, and blew out the limit. So we are tweaking this one setting to allow jars of any size to be uploaded. The “right way” to do this in Flink is to leave the jars in the local lib/ folder, but for <reasons> on K8s, that’s a bad idea.
Elasticsearh, I only deployed single node. I don’t think multi node is supposed to be that much harder, but for this demo I didn’t need it and was busy focusing on my trashy front end design.
Kibana works fine IF ES is running smoothly. If Kibana is giving you a hard time, go check ES.
I’d like to have a moment of silence for all the hard work that went in to making this such an easy thing to do.
A little kubectl apply/expose also was all it took to expose my bootleggy website. There’s probably an entire blog post on just doing that, but again, we’re keeping this one high level. If you’re really interested check out.
Make a simple static website, then Docker it up. (Example)
Make a yaml that runs the Dockerfile you just made (Example)
Make an ingress that points to your exposed service. (Example)
Which is actually a really nice segway into talking about Ingresses. The idea is you K8s cluster is hidden away from the world, operating in it’s own little universe. We want to poke a few holes and expose that universe to the outside.
Because I ran out of time, I ended up just using the prepackaged Flink WebUI and Kibana as iFrames on my “website”. As such, I poked several holes and you can see how I did it here:
Those were hand rolled and have minimum nonsense, so I think they are pretty self explanatory. You give it a service, a port, and a domain host. Then it just sort of works, bc computers are magic.
Conclusions
So literally as I was finishing the last paragraph I got word that my little project has been awarded 3rd place, but there were a lot of people in the competition so it’s not like was 3rd of 3 ( I have a lot of friends who read this blog (only my friends read this blog?), and we tend to cut at each other a lot).
More conclusively though, a lot of times when you’re tinkering like me, its easy to get off on one little thing and not build full end to end systems. Even if you suck at building parts, it helps illustrate the vision. Imagine you’ve never seen a horse. Then imagine I draw the back of one, and tell you to just imagine what the front is like. You’re going to be like, “WTF?”. So to tie this back in to Brian Holt’s “Full Stack Developer” tweet, this image is still better than “close your eyes and make believe”.
I take this even further in my next post. I made the Star Trek Bot Algorithm over a year ago and had it (poorly) hooked up to twitter. I finally learned some React over the summer and now I have a great way to kill hours and hours of time, welcome to the new Facebook. startrekbots.com
Welcome back from Part 1. On our last episode we did an introduction, spoke briefly on the overall structure of the program, discussed our demo data source, and did some foreshadowing of this week. This week we’ll do a bit of what we foreshadowed.
The Streaming Engine
Or How to Do Weird Stuff with Apache Flink
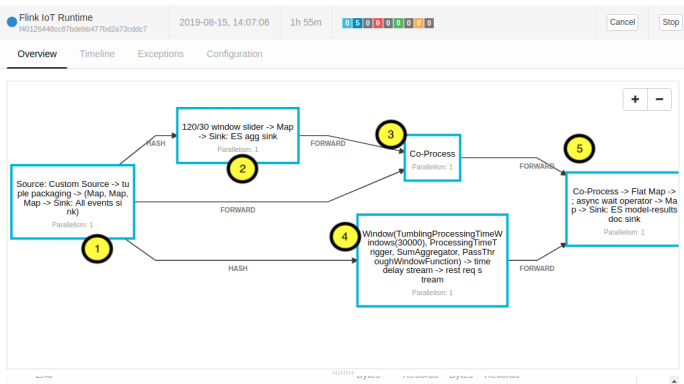
Let’s start off by looking at some pictures. Let me show you the DAG of the Flink Streaming Job to provide some motivation, and then we can go through piece by piece and look at the implementations.
From the “architecture diagram” in Episode 1, this is what the Flink Job is doing.
We pick up the data from MQTT
We apply a sliding window doing some simple analytics on the data (Count, Min, Max, Average, Sum Squared Deviations, Standard Deviation)
We join each record to the last analytics emitted from the sliding window
We update the list of REST endpoints which serve the models every 30 seconds
We send each Record + Last Emitted Analytics pair as a REST request to each model, and then sink the Record, Analytics, and Model Result (for each model) to Elasticsearch.
Pretty easy peasy. If you’re not interested in Apache Flink, you can basically stop here and know/understand that Record from Divvy Bike Station + Analytics + Model Results are sunk (written) into Elasticsearch and that by continuously polling an endpoint that returns other active endpoints we can dynamically add/delete/update the models being ran on this stream of data.
The most important call out is that MQTT will disconnect brokers with the same clientID because it thinks they are old and stale, so make we have to make the clientID random. This was a particularly nasty and inconsistent bug to track down, but turns out many other have had this problem. The solution here was just to add a string of milliseconds since the epoch. Probably would need something more for production but this is an MVP.
Aside from that little quirk, this all works basically like an Apache Kafka or any other connector.
Apply the Sliding Window
This was a bit of a trick because I didn’t want to hard code the data structure into the engine. I would like to eventually auto determine the schema of the json, but because of time constraints I set it up to be passed as a command line argument (but ended up hard coding what the CLI argument would be – see here).
This is important because we don’t want the window to be trying to compute analytics on text fields, and the data coming in form MQTT is all going to look like a string.
If you look at the code in ProcessWindowAnalyticsFunction you can see that function expects a schema to come in with the records, and in that schema any field that is listed as ‘Numeric’ we will attempt to compute analytics on. Admittedly here, we are trading off performance for a single engine that will compute any data source.
Joining the Records and Last Reported Analytics
At this point, I had been doing A LOT of Java, which to be candid, I really don’t care for- so I switched over to Scala. It’s really not a particularly interesting function. It simply joins all records with the last reported analytics from the sliding window. You’re free to check it out here and make comments if you have questions. I realize there’s a lot of magic-hand-waiving and me telling the reader to “go look for yourself”, for this blog / tutorial, but I am assuming you are fairly familiar with all of the tools I am using and I’m trying to give the reader a high level view of how this all fits together. If you have specific questions, please ask in the comments or email me (you can find me around the interwebs pretty easily).
The “Other” Stream
Now let’s shift and consider our “other” stream. The stream that simply polls an endpoint which serves us other endpoints every thirty seconds. This is accomplished effectively by doing a time windowed stream on all of the events coming from the records source- throwing them all away, and then once every 30 seconds (but you could configure that), sending an Asyncy REST request to a preordained URL that holds the REST endpoints for the models.
You can see this in my github lines approx 140-159. The endpoint that this system is hitting is being served in Apache OpenWhisk (which I absolutely love if you haven’t been able to gleam from my other blog posts, it’s like AWS / Google Cloud Functions except not proprietary vendor lock-in garbage).
You can see the response this gives here. Obviously, a “next step” would be for this to hit some sort of database where you could add/delete entries. (If you’re to lazy to click, it basically just returns a json of { endpoints: [ { modelOneName: “http://the-url”}, …]}
Merging it All Together and Making Async Calls
Now we bring everything together. From one stream we have Device Event Records and analytics on those records, from the other we have a list of URLs which will serve models. Now- it’s worth pointing out here, that while not implemented in a “real” version an easy add would be to have another field in the model name that specifies what devices it applies to- since that model is expecting certain input fields and different devices will have different fields. Again- a MINIMUM viable product is presented.
The rest is pretty simple conceptually- for each record/analytics item- it goes through the list of all applicable URLs (in this case all of the URLs), and pings each with the record and analytics as the payload. The code is here and may be more illuminating. The magic happens in the main program right here.
The Async ping models is nice because as different requests come back at different speeds, they don’t hold up the rest of the stream. A bug/feature can be introduced though if you don’t want the entire program to go flying off the rails if there is a single REST request. To do that you must set the “timeout” of the Async function, my choice was to “ignore” but you could in theory re-request, allow up to X fails in a Y time, etc.
Conclusion
I want to state one more time- that this was a lot of waive-my-hands magic, and “go look for yourself”dom. I probably could have made a 5 part blog just out of this post- but 1. I’m trying to write a book on something else already, and 2. the point of this blog series is an over view of how I built a “full stack” IoT Analytics solution from scratch part time in a couple of weeks.
Next Time
We’ll follow our hero into his mis-adventures in React, especially with the Dread Design System: Carbon.
It’s got everything- buzzwords, a corresponding YouTube video, a Twitter handle conjugated as a proper noun.
Introduction
Just go watch the video– I’m not trying to push traffic to YouTube, but it’s a sort of complicated thing and I don’t do a horrible job of explaining it in the video. You know what, I’m just gonna put it in line.
Ok, so Now you’ve see that. And you’re wondering? How in the heck?! Well good news- because you’ve stumbled to the behind the scenes portion where I explain how the magic happened.
There’s a lot of magic going on in there, and some you probably already know and some you’ve got no idea. But this is the story of my journey to becoming a full stack programmer. As it is said in the Tao of Programming:
There once was a Master Programmer who wrote unstructured programs. A novice programmer, seeking to imitate him, also began to write unstructured programs. When the novice asked the Master to evaluate his progress, the Master criticized him for writing unstructured programs, saying, “What is appropriate for the Master is not appropriate for the novice. You must understand Tao before transcending structure.”
I’m not sure if I’m the Master or the Novice- but this program is definitely unstructured AF. So here is a companion guide that maybe you can learn a thing or two / Fork my repo and tell your boss you did all of this yourself.
Table of Contents
Here’s my rough outline of how I’m going to proceed through the various silliness of this project and the code contained in my github repo .
YOU ARE HERE. A sarcastic introduction, including my dataset, WatsonIoT Platform (MQTT). Also we’ll talk about our data source- and how we shimmed it to push into MQTT, but obviously could (should?) do the same thing with Apache Kafka (instead). I’ll also introduce the chart- we might use that as a map as we move along.
In the second post, I’ll talk about my Apache Flink streaming engine- how it picks up a list of REST endpoints and then hits each one of them. In the comments of this section you will find people telling me why my way was wrong and what I should have done instead.
In this post I’ll talk about my meandering adventures with React.js, and how little I like the Carbon Design System. In my hack-a-thon submission, I just iFramed up the Flink WebUI and Kibana, but here’s where I would talk about all the cool things I would have made if I had more time / Carbon-React was a usable system.
In the last post I’ll push this all on IBM’s K8s. I work for IBM, and this was a work thing. I don’t have enough experience on any one else’s K8s (aside from microK8s which doesn’t really count) to bad mouth IBM. They do pay me to tell people I work there, so anything to rude in the comments about them will most likely get moderated out. F.u.
Data Source
See README.md and scroll down to Data Source. I’m happy with that description.
As the program is currently, right about here the schema is passed as a string. My plan was to make that an argument so you could submit jobs from the UI. Suffice to say, if you have some other interesting data source- either update that to be a command line parameter (PRs are accepted) or just change the string to match your data. I was also going to do something with Schema inference, but my Scala is rusty and I never was great at Java, and tick-tock.
Watson IoT Platform
I work for IBM, specifically Watson IoT, so I can’t say anything bad about WatsonIoT. It is basically based on MQTT, which is a pub-sub thing IBM wrote in 1999 (which was before Kafka by about 10 years, to be fair).
If you want to see my hack to push data from the Divvy API into Watson IoT Platform, you can see it here. You will probably notice a couple of oddities. Most notably, that only 3 stations are picked up to transmit data. This is because the Free account gets shut down after 200MB of data and you have to upgrade to a $2500/mo plan bc IBM doesn’t really understand linear scaling. /shrug. Obviously this could be easily hacked to just use Kafka and update the Flink Source here.
The Architecture Chart
That’s also in the github, so I’m going to say just look at it on README.md.
Coming Up Next:
Well, this was just about the easiest blog post I’ve ever written. Up next, I may do some real work and get to talking about my Flink program which picks up a list of API endpoints every 30 seconds, does some sliding window analytics, and then sends each record and the most recent analytics to each of the end points that were picked up, and how in its way- this gives us dynamic model calling. Also- I’ll talk about the other cool things that could/should be done there that I just didn’t get to. /shrug.
or “how I accidentally enslaved humanity to the Machine Overlords”.
The Borg are a fictional group from the Sci-Fi classic, Star Trek, who among other things have a collective consciousness. This creates a number of problems for the poor humans (and other species) that attempt to resist the Borg, as they are extremely adaptive. When a single Borg Drone learns something, its knowledge is very quickly propagated through the collective, presumably subject to network connectivity issues, and latency.
Here we create a system for an arbitrary number edge devices to report sensor data, a central processor to use the data to understand the environment the edge devices are participating in, and finally to make decisions / give instructions back to the edge device. This is in essence what the Borg are doing. Yes, there are some interesting biological / cybernetic integrations, however as far as the “hive mind” aspect is concerned, this is basic principles in play.
I originally built this toy to illustrate that “A.I.” has three principle components: Real time data going into a system, an understanding of the environment is reached, a decision is made. (1) Real Time artifical intelligence, like the “actual” intelligence it supposedly mimics is not making E.O.D. batch decisions. (2) In real time the system is aware of what is happening around it- understanding its environment and then using that understanding to (3) make some sort of decision about how to manipulate that environment. Read up on definitions of intelligence, a murky subject itself.
Another sweet bonus, I wanted to show that sophisticated A.I. can be produced with off-the-shelf components and a little creativity, despite what vendors want to tell you. Vendors have their place. It’s one thing to make something cool, another to productionalize it- and maybe you just don’t care enough. However, since you’re reading this- I hope you at least care a little.
Artificial Intelligence is by no means synonymous with Deep Learning, though Deep Learning can be a very useful tool for building A.I. systems. This case does real time image recognition, and you’ll note does not invoke Deep Learning or even the less buzz-worthy “neural nets” at any point. Those can be easily introduced to the solution, but you don’t need them.
Like the Great and Powerful Oz, once you pull back the curtain on A.I. you realize its just some old man who got lost and creatively used resources he had lying around to create a couple of interesting magic tricks.
System Architecture
OpenCV is the Occipital Lobe, this is where faces are identified in the video stream.
Apache Kafka is the nervous system, how messages are passed around the collective. (If we later need to defeat the Borg, this is probably the best place to attack- presuming we of course we aren’t able to make the drones self aware).
Apache Flink is the collective consciousness of our Borg Collective, where thoughts of the Hive Mind are achieved. This is probably intuitive if you are familiar with Apache Flink.
Apache Solr is the store of the “memories” of the collective consciousness.
The Apache Mahout library is the “higher order brain functions” for understanding. It is an ideal choice as it is well integrated with Apache Flink and Apache Spark
Apache Spark with Apache Mahout gives our creation a sense of conext, e.g. how do I recognize faces? It quickly allows us to bootstrap millions of years of evolutionary biological processes.
(5) Detected faces are turned in to Java Buffered Images, greyscaled and size-scaled to the size used for Eigenface calculations and binarized (inefficient). The binary arrays are passed as messages to Kafka.
(6) Flink picks up the images, converts them back to buffered images. The buffered image is then decomposed into linear a linear combination of the Eigenfaces calculated in (1).
(7) Solr is queried for matching linear combinations. Names associated with best N matches are assigned to each face. I.e. face is “identified”… poorly. See next comments.
(8) If the face is of a “new” person, the linear combinations are written to Solr as a new potential match for future queries.
(8) Instructions for edge device written back to Kafka messaging queue as appropriate.
Problems
A major problem we instantly encountered was that sometimes OpenCV will “see” faces that do not exist, as patterns in clothing, shadows, etc. To overcome this we use Flink’s sliding time window and Mahout’s Canopy clustering. Intuitively, faces will not momentarily appear and disappear within a frame, cases where this happens are likely errors on the part of OpenCV. We create a short sliding time window and cluster all faces in the window based on their X, Y coordinates. Canopy clustering is used because it is able to cluster all faces in one pass, reducing the amount of introduced latency. This step happens between step (6) and (7)
In the resulting clusters there are either lots of faces (a true face) or a very few faces (a ghost or shadow, which we do not want). Images belonging to the former are further processed for matches in step (7).
Another challenge is certain frames of a face may look like someone else, even though we have been correctly identifying the face in question in nearby frames. We use our clusters generated in the previous hack, and decide that people do not spontaneously become other people for an instant and then return. We take our queries from step 7 and determine who the person is based on the cluster, not the individual frames.
Finally, as our Solr index of faces grows, our searches in Solr will become less and less effecient. Hierarchical clustering is believed to speed up these results and be akin to how people actually recognize each other. In the naive form, for each Solr Query will scan the entire index of faces looking for a match. However we can clusters the eigenface combinations such that each query will first only scan the cluster centriods, and then only consider eigenfaces in that cluster. This can potentially speed up results greatly.
Usecases
Borg
This is how the Borg were able to recognize Locutus of Borg.
Cylons
This type of system also was imperative for Cylon Raiders and Centurions to recognize (and subsequently not inadvertently kill) the Final Five.
Shorter Term
This toy was originally designed to work with the Petrone Battle Drones however as we see the rise of Sophia and Atlas, this technology could be employed to help multiple subjects with similar tasks learn and adapt more quickly. Additionally there are numerous applications in security (think network of CCTV cameras, remote locks, alarms, fire control, etc.)
Do you want Cylons? Because that’s how you get Cylons.
Alas, there is no great and powerful Oz. Or- there is, and …
References
Flink Forward, Berlin 2017 SlidesVideo (warning I was sick this day. Not my best work).
For a bigger project which I hope to blog about soon, I needed to get the OpenCV Java Native Library (JNI) running in a Flink stream. It was a pain in the ass, so I’m putting this here to help the next person.
First thing I tried… Just doing it.
For OpenCV, you need to statically initialize (I’m probably saying this wrong) the library, so I tried something like this
val stream = env
.addSource(rawVideoConsumer)
.map(record => {
System.loadLibrary(Core.NATIVE_LIBRARY_NAME)
…
Well, that kicks an error that looks like:
Exception in thread "Thread-143" java.lang.UnsatisfiedLinkError:
Native Library /usr/lib/jni/libopencv_java330.so already loaded in
another classloader
Ok, that’s fair. Multiple task managers, this is getting loaded all over the place. I get it. I tried moving this around a bunch. No luck.
Second thing I tried… Monkey see- monkey do: The RocksDB way.
In the Flink-RocksDB connector, and other people have given this advice, the idea is to include the JNI in the resources/fat-jar, then write out a tmp one and have that loaded.
This, for me, resulted in seemingly one tmp copy being generated for each record processed.
import java.io._

/**
* This is an example of an extremely stupid way (and consequently the way Flink does RocksDB) to handle the JNI problem.
*
* DO NOT USE!!
*
* Basically we include libopencv_java330.so in src/main/resources so then it creates a tmp version.
*
* I deleted from it resources, so this would fail. Only try it for academic purposes. E.g. to see what stupid looks like.
*
*/
object NativeUtils {
   // heavily based on https://github.com/adamheinrich/native-utils/blob/master/src/main/java/cz/adamh/utils/NativeUtils.java
    def loadOpenCVLibFromJar() = {

        val temp = File.createTempFile("libopencv_java330", ".so")
        temp.deleteOnExit()

        val inputStream= getClass().getResourceAsStream("/libopencv_java330.so")

        import java.io.FileOutputStream
        import java.io.OutputStream
        val os = new FileOutputStream(temp)
        var readBytes: Int = 0
        var buffer = new Array[Byte](1024)

        try {
           while ({(readBytes = inputStream.read(buffer))
              readBytes != -1}) {
              os.write(buffer, 0, readBytes)
           }
        }
        finally {
        // If read/write fails, close streams safely before throwing an exception
           os.close()
           inputStream.close
        }

        System.load(temp.getAbsolutePath)
    }

}
Third way: Sanity.
There were more accurately like 300 hundred ways I tried to make this S.O.B. work, I’m really just giving you the way points- major strategies I tried in my journey. This is the solution. This is the ‘Tomcat solution’ I’d seen referenced throughout my journey but didn’t understand what they meant. Hence why, I’m writing this blog post.
I created an entirely new module. I called it org.rawkintrevo.cylons.opencv. In that module there is one class.
package org.rawkintrevo.cylon.opencv;

import org.opencv.core.Core;

public class LoadNative {

   static {
      System.loadLibrary(Core.NATIVE_LIBRARY_NAME);
   }

   native void loadNative();
}
I compiled that as a fat jar and dropped it in flink/lib
Then, where I would have run System.loadLibrary(Core.NATIVE_LIBRARY_NAME), I now put Class.forName("org.rawkintrevo.cylon.opencv.LoadNative").
It’s learning Friday, and I’m getting this out late so I’ll try to make it short and sweet. In this post we’re going to create a simple streaming program that hits the twitter statuses endpoint.
This is based on a demo from my recent talk at Flink Forward 2016. As always, I will be doing this in Apache Zeppelin notebooks, because I am lazy and don’t like to compile jars.
Step 1. Create API Keys
Go to twitter application management and create a new app. After you create the application, click on it. Under the Keys and Access Tokens Tab you will see the Consumer Key and Consumer Secret. Scroll down a little ways and you will also see Access Token and Access Token Secret. Leave this tab open, you’ll need it shortly.
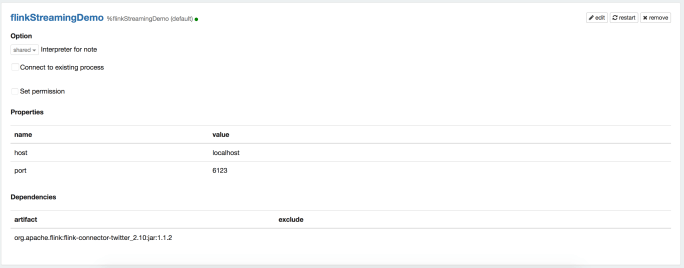
Step 2. Open Zeppelin, create a new Interpreter for the Streaming Job.
In the first paragraph we are going to define our new interpreter. We need to add the dependency org.apache.flink:flink-connector-twitter_2.10:1.1.2. Also, if you’re running in a cluster you also need to download this jar to $FLINK_HOME/lib and restart the cluster.
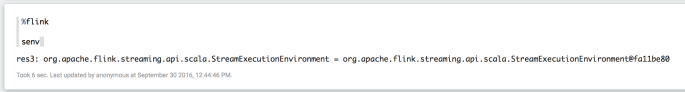
NOTE If you haven’t updated your Zeppelin in a while, you should do that. You need to have a version of Zeppelin that is using Apache Flink v1.1.2. This is important because that update to Zeppelin also introduced the Streaming context to Flink notebooks in Zeppelin. A quick way to test your if your Zeppelin is OK, is to run the following code in a paragraph, and see no errors.
%flink

senv
Step 3. Set your authorization keys.
Refer to Step 1 for your specific keys, but create a notebook with the following code:
%flinkStreamingDemo
//////////////////////////////////////////////////////
// Enter our Creds
import java.util.Properties
import org.apache.flink.streaming.connectors.twitter.TwitterSource

val p = new Properties();
p.setProperty(TwitterSource.CONSUMER_KEY, "");
p.setProperty(TwitterSource.CONSUMER_SECRET, "");
p.setProperty(TwitterSource.TOKEN, "");
p.setProperty(TwitterSource.TOKEN_SECRET, "");
Obviously, plug your keys/tokens in- I’ve deleted mine.
Step 4. Create an end point to track terms
I’ve created a simple endpoint to capture all tweats containing the words pizza OR puggle OR poland. See the docs for more information on how twitter queries work.
%flinkStreamingDemo

import com.twitter.hbc.core.endpoint.{StatusesFilterEndpoint, StreamingEndpoint}
import scala.collection.JavaConverters._

// val chicago = new Location(new Location.Coordinate(-86.0, 41.0), new Location.Coordinate(-87.0, 42.0))

//////////////////////////////////////////////////////
// Create an Endpoint to Track our terms
class myFilterEndpoint extends TwitterSource.EndpointInitializer with Serializable {
    @Override
    def createEndpoint(): StreamingEndpoint = {
        val endpoint = new StatusesFilterEndpoint()
        //endpoint.locations(List(chicago).asJava)
        endpoint.trackTerms(List("pizza", "puggle", "poland").asJava)
        return endpoint
    }
}
I’ve also commented out, but left as reference how you would do a location based filter.
Step 5. Set up the endpoints
Nothing exciting here, just setting up and initializing the endpoints.
%flinkStreamingDemo

import org.apache.flink.streaming.api.scala.DataStream
import org.apache.flink.streaming.api.windowing.time.Time
import org.apache.flink.core.fs.FileSystem.WriteMode

val source = new TwitterSource(p)
val epInit = new myFilterEndpoint()

source.setCustomEndpointInitializer( epInit )

val streamSource = senv.addSource( source );
Step 6. Setup the Flink processing and windowing.
This is an embarrassingly simple example. Flink can do so much, but all we’re going to do is show off a little bit of its windowing capability (light years ahead of Apache spark streaming).
Everything else is somewhat trivial- this is the code of interest that the user is encouraged to play with.
%flinkStreamingDemo

streamSource.map(s => (0,1))
    .keyBy(0)
    // sliding time window of 1 minute length and 30 secs trigger interval
    .timeWindow(Time.minutes(2), Time.seconds(30))
    .sum(1)
    .map(t => t._2)
    .writeAsText("/tmp/2minCounts.txt", WriteMode.OVERWRITE)

senv.execute("Twitter Count")
We count the tweets in each window and the counts by window are saved to a text file. Not very exciting.
Exercises for the reader:
– Different windowing strategies
– Doing an action on the tweet like determining which keyword it contains
— Count by keyword
– Joining windows of different lengths (e.g. how many users tweeted in this window who have also tweeted in the current 24 hour window).
Etc.
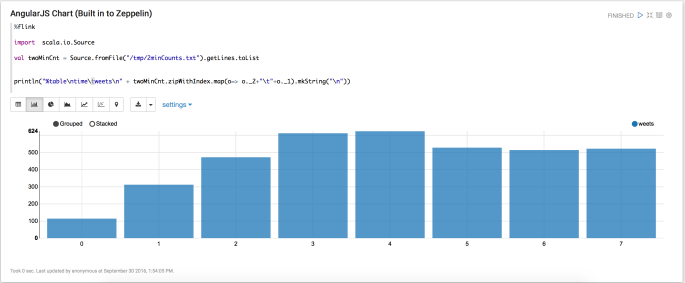
Step 7. Visualize results.
Because there is a two minute window, you need to give this some time collect a window and write the results to 2minCounts.txt. So go grab a coffee, tweet how great this post is, etc.
That code will read the text file and turn it in to a table that Zeppelin can understand and render in AngularJS. In this chart, the numbers on the x axis are the ‘epochs’ that is the 2 minute windows offset by 30 seconds each.
UPDATE
Remember how we created a new interpreter called %flinkStreamingDemo?
So here is the thing with a Flink streaming job, and Zeppelin. When you ‘execute’ the streaming paragraph from Step 6, that job is going to run forever.
If you are running Flink in a cluster, you have three options:
– Restart the interpreter. This will free the interpreter, but the streaming job will still be running- you can verify this in the Flink WebUI (also, the Flink WebUI is where you can stop the job). Now that control of the interpreter has been returned to you, you can run the visualization code with the %flinkStreamingDemo interpreter.
– You can use another Flink interpreter such as %flink. This will also work fine.
– You can use another Scala interpreter (such as the %ignite or %spark interpreter). This is fine, because the visualization code doesn’t leverage Flink in anyway, only pure Scala to read the file and convert it into a Zeppelin %table
If you’re in local mode (e.g. you don’t have a Flink Cluster running) you’ll likely see an error: java.net.BindException: Address already in use when you try to use another %flink interpreter. This is an opportunity for improvement in Zeppelin as the FlinkLocalMiniCluster always binds to 6123. In this case, the only option is #3 from above, simply run the code from any other Scala based interpreter (or use Python or R, but you’ll need to alter the code for those languages). All we need to do here is read the file, give it two headers and create a tab-separated string that starts with %table.
Again, because for the visualization, we don’t need anything that Flink does. We’re simply loading a file and creating a string.
Troubleshooting
If you see NO DATA AVAILABLE you either:
– didn’t wait long enough (wait at least the length of the window plus a little)
– you entered your credentials wrong
– you have a rarely use term and there is no data
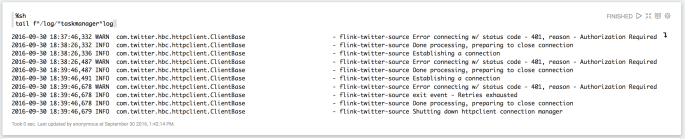
Bad Auth
tail f*/log/*taskmanager*logprobably won’t work for you, but you need to check those logs for something that looks like this.
The whole enchilad
%flinkStreamingDemo
import java.util.Properties
import org.apache.flink.streaming.connectors.twitter.TwitterSource
import com.twitter.hbc.core.endpoint.{StatusesFilterEndpoint, StreamingEndpoint, Location}

import scala.collection.JavaConverters._

import org.apache.flink.streaming.api.scala.DataStream
import org.apache.flink.streaming.api.windowing.time.Time
import org.apache.flink.core.fs.FileSystem.WriteMode


//////////////////////////////////////////////////////
// Enter our Creds
val p = new Properties();
p.setProperty(TwitterSource.CONSUMER_KEY, "");
p.setProperty(TwitterSource.CONSUMER_SECRET, "");
p.setProperty(TwitterSource.TOKEN, "");
p.setProperty(TwitterSource.TOKEN_SECRET, "");

val chicago = new Location(new Location.Coordinate(-86.0, 41.0), new Location.Coordinate(-87.0, 42.0))

//////////////////////////////////////////////////////
// Create an Endpoint to Track our terms
class myFilterEndpoint extends TwitterSource.EndpointInitializer with Serializable {
    @Override
    def createEndpoint(): StreamingEndpoint = {
        val endpoint = new StatusesFilterEndpoint()
        //endpoint.locations(List(chicago).asJava)
        endpoint.trackTerms(List("pizza", "puggle", "poland").asJava)
        return endpoint
    }
}

val source = new TwitterSource(p)
val epInit = new myFilterEndpoint()

source.setCustomEndpointInitializer( epInit )

val streamSource = senv.addSource( source );

streamSource.map(s => (0,1))
    .keyBy(0)
    // sliding time window of 2 minute length and 30 secs trigger interval
    .timeWindow(Time.minutes(2), Time.seconds(30))
    .sum(1)
    .map(t => t._2)
    .writeAsText("/tmp/2minCounts.txt", WriteMode.OVERWRITE)


senv.execute("Twitter Count")
Big Data for n00bsis a new series I’m working on targeted at absolute beginners like my self. The goal is to make some confusing tasks more approachable. The first few posts will be spin offs of a recent talk I gave at Flink Forward 2016 Apache Zeppelin- A Friendlier Way To Flink (will link video when posted).
Graph databases are becoming an increasingly popular way to store and analyze data, especially when relationships can be expressed in terms of objectverbobject. For instance, social networks are usually represented in graphs such as
Jack likes Jills_picture
A full expose on the uses and value of graph databases is beyond the scope of this blog post however the reader is encouraged to follow these links for a more in depth discussion:
Using d3js and Apache Zeppelin to Visualize Graphs
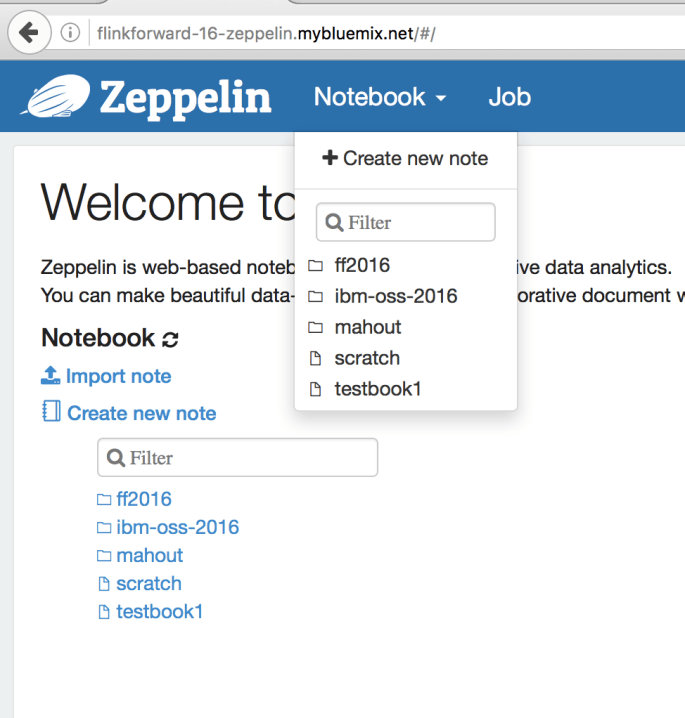
First, download Apache Zeppelin (click the link and choose the binary package with all interpreters) then “install” Zeppelin by unzipping the downloaded file and running bin/zeppelin-daemon.sh start or bin/zeppelin.cmd (depending on if you are using windows or Linux / OSX). See installation instructions here.
You should see a “Welcome to Zeppelin” page. We’re going to create a new notebook by clicking the “Notebook” drop down, and the “+Create new note”.
Call the notebook whatever you like.
Add dependencies to the Flink interpreter
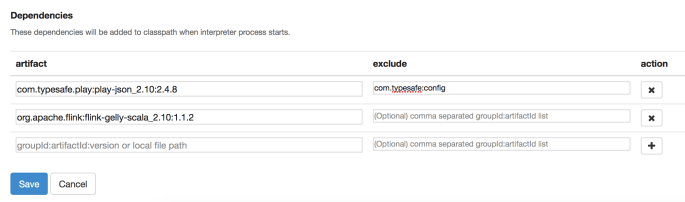
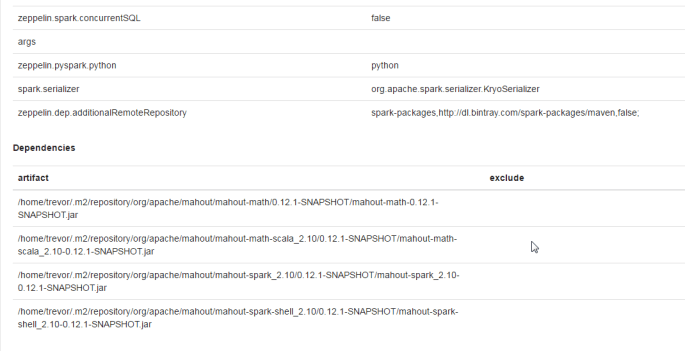
Next we need to add two dependencies to our Flink interpreter. To do this we go to the “Interpreters” page, find the “Flink” interpreter and add the following dependencies:
com.typesafe.play:play-json_2.10:2.4.8
used for reading JSONs
org.apache.flink:flink-gelly-scala_2.10:1.1.2
used for the Flink Gelly library
We’re also going to exclude com.typesafe:config from the typesafe dependency. This packaged tends to cause problems and is not necessary for what we are doing, so we exclude it.
The dependencies section of our new interpreter will look something like this:
Downloading some graph data
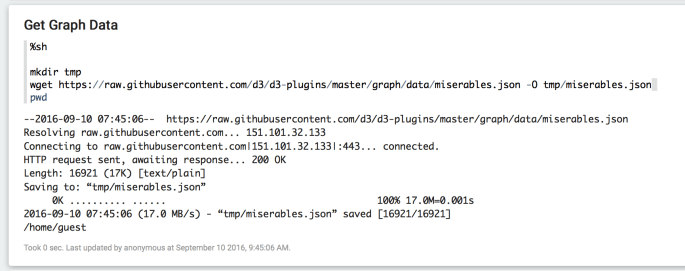
Go back to the notebook we’ve created. In the first paragraph add the following code
%sh

mkdir tmp

wget https://raw.githubusercontent.com/d3/d3-plugins/master/graph/data/miserables.json -O tmp/miserables.json
It should look like this after you run the paragraph (clicking the little “play” button in top right corner of paragraph):
What we’ve done there is use a Linux command wget to download our data. It is also an option to simply download the data your browser, you could for example right click on this link and click “Save As…” but if you do that, you’ll need to edit the next paragraph to load the data from where ever you saved it to.
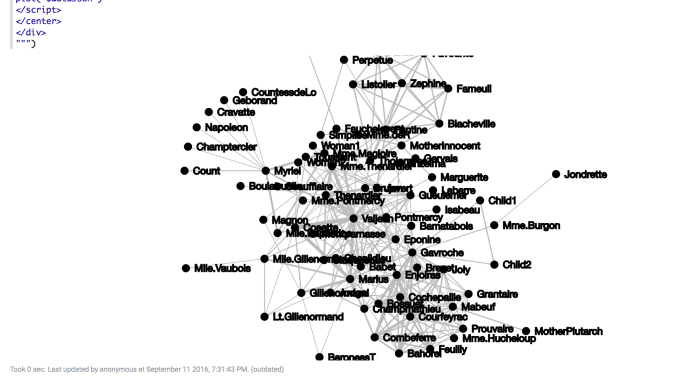
Visualizing Data with d3js
d3js is a Javascript library for making some really cool visualizations. A fairly simple graph visualization was selected to keep this example fairly simple; a good next step would be to try a more advanced visualization.
Now, check out what we just did there: println(s"""%html ... $dataJson. We just created a string that started with the %html tag, letting Zeppelin know, this is going to be a HTML paragraph, render it as such, and then passed the data directly in. If you were to inspect the page you would see the entire json is present in the html code.
This is the (messy) graph we get.
From here, everything is a trivial exercise.
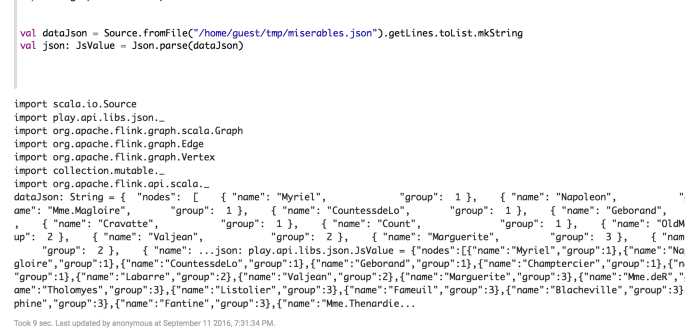
Let’s load this graph data into a Gelly Graph:
val vertexDS = benv.fromCollection(
(json \ "nodes" \\ "name")
.map(_.toString).toArray.zipWithIndex
.map(o => new Vertex(o._2.toLong, o._1)).toList)

val edgeDS = benv.fromCollection(
((json \ "links" \\ "source")
.map(_.toString.toLong) zip (json \ "links" \\ "target")
.map(_.toString.toLong) zip (json \ "links" \\ "value")
.map(_.toString.toDouble))
.map(o => new Edge(o._1._1, o._1._2, o._2)).toList)

val graph = Graph.fromDataSet(vertexDS, edgeDS, benv)
Woah, that looks spooky. But really is not bad. The original JSON contained a list called nodes which held all of our vertices, and a list called links which held all of our edges. We did a little hand waving to parse this into the format expected by Flink to create an edge and vertex DataSet respectively.
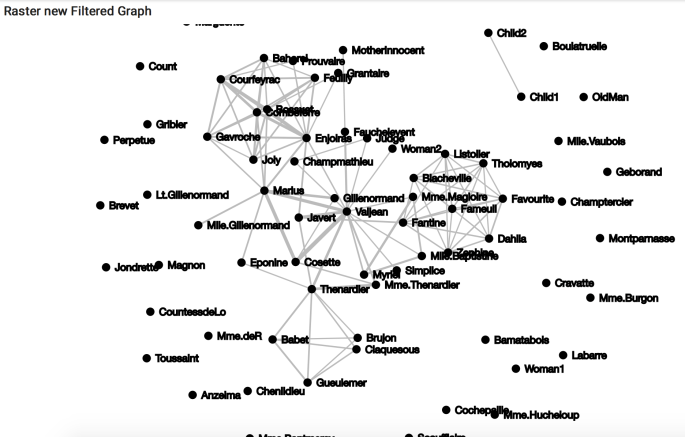
From here, we can do any number of graph operations on this data, and the user is encouraged to do more. For illustration, I will perform the most trivial of tasks: filtering on edges whose value is greater than 2.
val filteredGraph = graph.filterOnEdges(edge => edge.getValue > 2.0)
Now we convert our data back in to a json, and use the same method to re-display the graph. This is probably the most complex operation in the entire post.
As we see we are creating a json string from the edges and vertices of the graph. We call filteredGraph.getVertices.collect() and then map those vertices into the format expected by the json. In this case, our rendering graph expects a list of dictionaries of the format { "name" : }. The edges follow a similar pattern. In summation though we are simply mapping a list of of collected vertices/edges to string representations in a json format.
Finally, we repeat our above procedure for rendering this new json. An imporant thing to note, our code for mapping the graph to the json will work for this no matter what operations we perform on the graph. That is to say, we spend a little time setting things up, from a perspective of translating our graphs to jsons and rendering our jsons with d3js, and then we can play as much as we want with our graphs.
Also note we have changed $dataJson to $jsonOutStr as our new graph is contained in this new string.
A final important call out is the d3.select("#foo2") and <div id="foo2"> in the html string. This is creating a container for the element, and then telling d3js where to render the element. This was the hardest part for me; before I figured this out, the graphs kept rendering on the grey background behind the notebooks- which is cool, if that’s what you’re going for (custom Zeppelin skins anyone?), but very upsetting if it is not what you want.
New filtered graph.
Conclusions
Apache Zeppelin is a rare combination of easy and powerful. Simple things like getting started with Apache Flink and the Gelly graph library are fairly simple, however we are still able to add in powerful features such as d3js visualizations, with relatively little work.
I was at Apache Big Data last week and got to talking to some of the good folks at the Apache Mahout project. For those who aren’t familiar, Apache Mahout is a rich Machine Learning and Linear Algebra Library that originally ran on top of Apache Hadoop, and as of recently runs on top of Apache Flink and Apache Spark. It runs in the interactive Scala shell but exposes a domain specific language that makes it feel much more like R than Scala.
Well, the Apache Mahout folks had been wanting to build out some visualization capabilities comparable to matplotlib and ggplot2 (Python and R respectively). They had considered integrating with Apache Zeppelin and utilizing the AngularJS framework native to Zeppelin. We talked it out, and decided it made much more sense to simply usethe matplotlib and ggplot2 features of Python and R, and Apache Zeppelin could to facilitate that somewhat cumbersome pipeline.
So I dinked around with it Monday and Tuesday, learning my way around Apache Mahout, and overcoming an issue with an upgrade I made when I rebuilt Zeppelin (in short I needed to refresh my browser cache…).
Without further ado, here is a guide on how to get started playing with Apache Mahout yourself!
Step 1. Clone / Build Apache Mahout
At the bash shell (e.g. command prompt, see my other blog post on setting up Zeppelin + Flink + Spark), enter the following:
git clone https://github.com/apache/mahout.git
cd mahout
mvn clean install -DskipTests
That will install Apache Mahout.
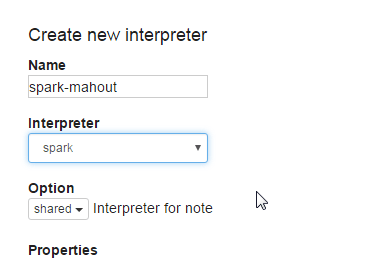
Step 2. Create/Configure/Bind New Zeppelin Interpreter
Make sure to click ‘Save’ when you are done. Also, maybe this goes without saying, maybe it doesn’t… but
make sure to change username to your actual username, don’t just copy and paste!
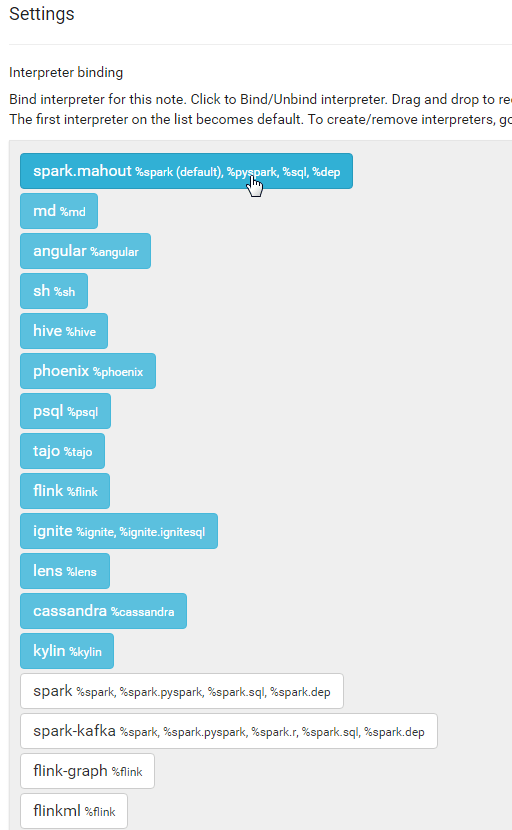
Step 2c. Bind
In any notebook in which you want to use the spark-mahout interpreter, not the regular old Spark one, you need to bind correct interpreter.
Create a new notebook, lets call it “[MAHOUT] Binding Example”.
In the top right, you’ll see a little black gear, click on it. A number of interpreters will pop up. You want to click on the Spark one at the top (such that is becomes un-highlighted) then click on the “spark-mahout” one toward the bottom. Finally drag the “spark-mahout” one up to the top. Finally, as always, click on ‘Save’.
Now, this notebook knows to use the spark-mahout interpreter instead of the regular spark interpreter (and so, all of the properties and dependencies you’ve added will also be used). You’ll need to do this for every notebook in which you wish to use the Mahout Interpreter!
Step 2d. Setting the Environment
Back at the command prompt, we need to tweek the environment a bit. At the command prompt (assuming you are in the mahout directory still):
./bin/mahout-load-spark-env.sh
And then we’re going to export some environment variables:
export MAHOUT_HOME=[directory into which you checked out Mahout]
export SPARK_HOME=[directory where you unpacked Spark]
export MASTER=[url of the Spark master]
If you are going to be using Mahout often, it would be wise to add those exports to $ZEPPELIN_HOME/conf/zeppelin-env.sh so they are loaded every time.
I’m going to do you another favor. Go to the Zeppelin home page and click on ‘Import Note’. When given the option between URL and json, click on URL and enter the following link:
That is where the magic happens and introduces Mahout’s SparkDistributedContext and the R-like Domain Specific Language.
You know how in Scala you can pretty much just write whatever you want (syntactic sugar run-amok) well a domain specific language (or DSL) lets you take that even further and change the syntax even further. This is not a precisely accurate statement, feel free to google if you want to know more.
The moral of the story is: what was Scala, now smells much more like R.
Further, for the rest of this notebook, you can now use the Mahout DSL, which is nice because it is the same for Flink and Spark. What that means is you can start playing with this right away using Spark-Mahout, but when the Flink-Mahout comes online soon (and I promise to update this post showing how to hook it up) you can copy/paste your code to your Flink-Mahout paragraphs and probably run it a bunch faster.
The Main Event
So the whole point of all of this madness was to monkey-patch Mahout into R/Python to take advantage of those graphics libraries.
UPDATE 5-29-16: Originally, I had accidentally re-linked the first notebook (sloppy copy-paste on my part)- this one shows ggplot2 integration, e.g. the entire point of this Blog post…
Ignore the first couple of paragraphs (by the time you read this I might have (unlikely, lol) cleaned this notebook up and deleted).
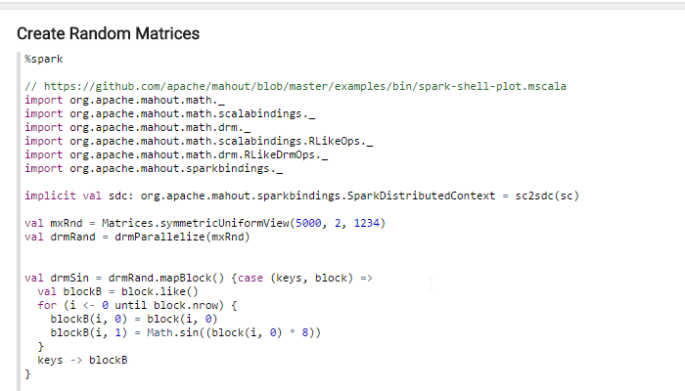
There is a paragraph that Creates Random Matrices
…yawn. You can grok it later. But again, notice those imports and creating the SparkDistributedContext. We’re using our SparkContext (sc ) that Zeppelin automatically creates in the paragraph to initialize this.
In the next paragraph we sample 1000 rows from the matrix. Why a sample? Well in theory the whole point of using Mahout is you’re going to be working with matrices much to big to fit in the memory of a single machine, much less graph them in any sort of meaningful way (think millions to trillions to bajillions of rows). How many do you really need. If you want to get a feel for the matrix as a whole, random sample. Depending on what you’re trying to do will determine how exactly you sample the matrix, just be advised- it is a nasty habit to think you are just going to visualize the whole thing (even though it is possible on these trivial examples). If that were possible in the first place on your real data, you’d have actually been better served to just used R to begin with…
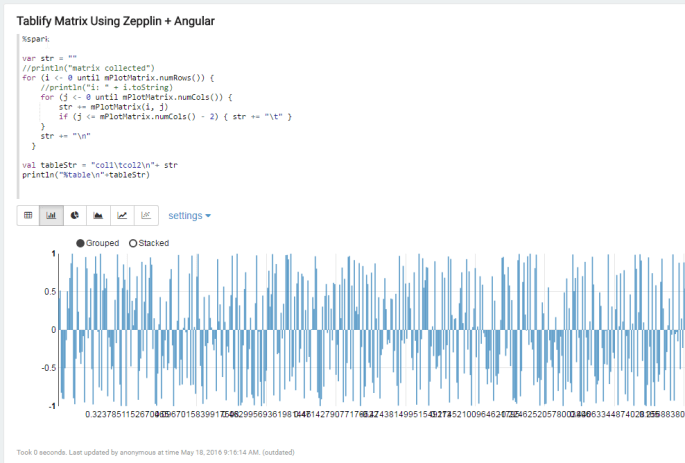
The next paragraph basically converts the matrix into a tab-separated-file, except it is held as a string and never actually written to disk. This loop is effective, but not ideal. In the near future we hope to wrap some syntactic sugar around this, simply exposing a method on the matrix that spits out a sampled *.tsv. Once there exists a tab-separated string, we can add %table to the front of the string and print it- Zeppelin will automatically figure out this is supposed to be charted and you can see here how we could use Zeppelin’s predefined charts to explore this table.
Keeping in mind this matrix was a sine function, this sampling looks more or less accurate. The Zeppelin graph is trying to take some liberties though and do aggregations on one of the columns. To be fair, we’re trying to do something weird here; something for which this chart wasn’t intended for.
Next, the tsv string is then stored in something known to Zeppelin as the ResourcePool. Almost any interpreter can access the resource pool and it is a great way to share data between interpreters.
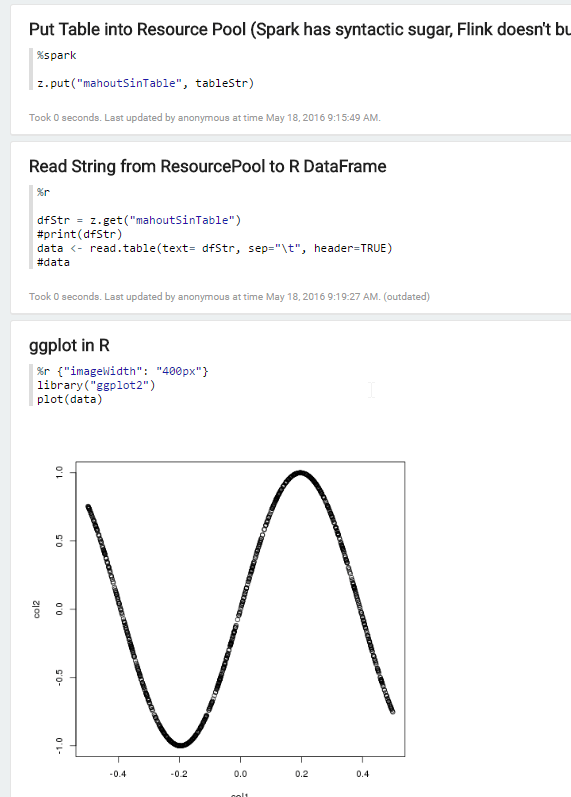
Once we have a *.tsv in memory, and it’s in the resource pool, all that is left is to “fish it out” of the resource pool and load it as a dataframe. That is an uncommon but not altogether unheard of thing to do in R via the read.table function.
Thanks to all of the work done on the SparkR-Zeppelin integration, we can now load our dataframe and simply use ggplot2 or a host of other R plotting packages (see the R tutorial).
A post thought
Another way to skin this cat would be to simply convert the Mahout Matrix to an RDD and then register it as a DataFrame in Spark. That is correct, however the point of Mahout is to be engine agnostic, and as Flink is mainly focused on streaming data and not building out Python and R extensions, it is unlikely a similar functionality would be exposed there.
However, you’re through the looking-glass now, and if doing the distributed row matrix -> resilient distributed data set -> Spark data frame -> read in R makes more sense to you/your use case, go nuts. Write a blog of your own and link back to me 😉
UPDATE 5-23: The world and ecosystem of Big Data evolves quickly. Most of these tools have gone through multiple releases since I first penned this article. I’ve tried to update accordingly. Good hunting.
That title is a lie, probably.
Spark is the hot new thing in big data. Flink will be the hot new thing in big data as internet-of-things, real-time analytics, and other buzz-words go from being stary-eyed promises made in sales pitches to things that actually happen. At the end of the day, most people don’t want to get their hands dirty monkeying around with the mechanics of this stuff, they just want a pretty web interface to use.
So to get paid a gagillion dollars, you basically just start tinkering with this and maybe contribute a bit here and there, then in 2 years when Flink and Spark are the new Microsoft Excel, you’re one of a couple thousand people in the world who have been working with this stuff for over a year. #!/bin/sh (pronounced ‘sha-bang’, more computer jokes, I digress) you’re getting paid a gagillion a year.
Let’s be real. Your proposed analytics stack could do some sci-fi black-magic analytics that perfectly predicts all of your KPIs, lottery numbers, and what color of ChuckTs you should rock with that awesome new dinosaur sweater you just got, but if it doesn’t have a sparkly, friendly, not-scary front-end you’re going to have a hard time getting any traction with it. (If you’re not doing this sort of thing day-to-day, then I’m sorry to say, this is the reality of things: people are inherently uncomfortable with submitting jobs via command line.)
Use Case #2: Having a pretty front end for your Spark / Flink like DataArtisans or DataBricks is nice, but for whatever reason you can’t put your data out on some cloud.
Because that one time that this happened…
So with out further ado, I present a nice recipe for setting up Apache Flink, Apache Spark, and Apache Zeppelin(incubating) in big-boy mode. (big-boy mode: Zeppelin comes pre-packaged with Flink and Spark, but you want to be pointing at full blown clusters of both of these because, y’know, science).
But really, this is a heavily documented (over documented?) recipe. It assumes no familiarity with linux and provides little blurbs and links about what each command is doing. I am an autodidact when it comes to computers and while blindly following recipes is nice for getting something going it doesn’t teach you much and if the slightest thing goes wrong you are totally lost. So proceed with no fear.
Step 0:
Because jebus-only-knows what kind of wierd-o setup any given box could have, I present this recipe on a fishbone (that is minimal install) Ubuntu Server 14.04.3 virtual machine. For demo purposes, this minimizes instances where
something weird is causing unique problems and
I miss a dependency because I have it on my computer, but you may not.
There are lots of tutorials on how to install Ubuntu on a virtual machine, but to be honest, if this step scares you, you should plan on this being a full day project or more. It’s really nothing more than a recipe, but you’re going to be doing a lot of learning along the way.
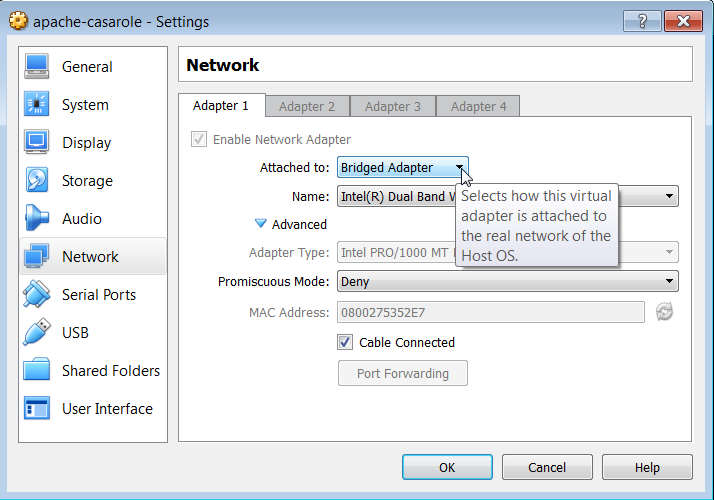
Make sure to setup the virtual box to use a bridged network adapter. A good write up on the differences can be found here. In short, in Oracle VirtualBox go in to the machine Settings -> Networking and select Bridged Adapter from the drop down.
Select Bridged Adapter from the drop down menu.
A bridged adapter basically has the fewest restrictions on the virtual machine. We’re going to be installing a lot of things that will be accessing ports on the host machine and this is just going to be a lot simple. If you’re curious go read more.
Gotchya
Throughout this tutorial I’ll point out things that seem trivial but if you variate from the script even slightly can totally derail you. I do this because I am not one to carefully follow directions and provide this information for others like me. In this case, the ‘gotchya’ is if the virtual machine is already running when you change this setting you need to restart the machine for the changes to take affect.
I only attest to this recipe working on a bare bones Ubuntu 14.04.3 Server installation (the link to exactly what I used is in the ingredients). If you decide to use another version of Ubuntu or flavor of Linux, you may have to tweak some things. Zeppelin, Flink, and Spark are all written in Java/Scala so theoretically this could be done on OSX or Windows, but you wouldn’t run a cluster on Windows or OSX boxes, and for a number of other reasons, I’ve chosen Ubuntu 14.04.3. Get this working then try to do something weird if you want.
Step 1- Prepping the Box
Some basic applications that will be required by the programs we are going to use. Software in Ubuntu is managed via apt. Generally speaking there are three ways to get software.
Download from the repository
Download binaries directly
Download and compile from source
In this episode, we’ll be doing all three. If you’re coming from windows and used to everything being pre-compiled for you with a nice pretty GUI installer… I don’t know what to tell you, other than ‘Welcome to Linux, this is life now.’
Any time you see the sudo apt-get we are telling the computer:
sudo literally: super user do
apt-get install use the package manager to install the requested software.
So we are using apt-get to install:
git
git is a program for software version control. We’ll be using to download the latest source code for programs we’re going to compile.
But Maven 3+ isn’t in the repository at the time of this writing. That is to say, if we use apt-get we will get a version of maven that is to old for what we need. So for maven, we are going to download a binary distribution and manually copy it into place.
Maven 3.1+
In the same way apt-get is a neat way to manage software which is kept in a repository, maven manages code libraries for us. Check out https://maven.apache.org/ for more info.
If you already have maven installed, we can use apt to remove software as well as install it.
sudo apt-get purge maven maven2
*note if you don’t have maven installed, this command isn’t going to hurt anything, you’re just going to see an error message about how there was nothing to uninstall.
At the time this article went to press, the main branch of Zeppelin didn’t have support for Flink 0.10 (which at the time of press was the current stable release of Flink). There is a discussion here, but the short version is you either need to hack Zeppelin yourself or use Till Rohrmann’s branch. For parsimony, I present the second method and leave ‘How to hack out Zeppelin’ as content for another post…
First, git clone Apache Zeppelin. This is the third method of getting software discussed earlier. We’re downloading source code to compile.
UPDATE 5-23: Originally we wanted to get Flink v0.10 and Till’s branch had this, now the real Zeppelin is updated to branch 1.0, so we got to the (real) source.
change directory (cd) to incubator-zeppelin
cd incubator-zeppelin
A git can have multiple branches. A good overview is here. We want to checkout the branch that Till made with the Zeppelin configuration for flink-0.10-SNAPSHOT.
git checkout flink-0.10-SNAPSHOT
Now we instruct maven (mvn) to clean and package the source found in the directory (more on maven build life-cycles). Additionally we pass flags to maven instructing it to build against Spark version 1.5 (-Pspark-1.5) and to skip the tests that make sure it compiled correctly. See Gotchya below.
UPDATE 5-23: This all seems to be working now. We add flags -Psparkr -Ppyspark -Pspark-1.6 to make Zeppelin build against Spark 1.6 (included since last time), add support for SparkR and support for pyspark. At the time of writing -Dflink.version=1.0 isn’t necessary, but will hopefully keep this working for a little while longer, especially after Flink v1.1 is released.
I explicitly didn’t use the -Pspark-1.5 flag. If I had, it would have built Zeppelin with an internal Spark interpreter at version 1.5. I was having all sorts of issues when doing this, and finally rolled back to make this a simple-as-possible case. If you want to try your hand at Spark 1.5, then add that flag and in the next section when you install Spark, checkout version 1.5 instead.
The maven build will take a little while (26 minutes for me). When it is done, you should see a message saying BUILD SUCEESS and some statistics.
And finally…drumroll… the moment you’ve all been waiting for … start the Zeppelin daemon.
sudo bin/zeppelin-daemon.sh start
Gotchya
You must use sudo when you start the zeppelin deamon. The onus is on you to remember to do this. It is absolutely possible to start the daemon without sudo and you will be able to run the Flink example listed below, however the Spark example won’t work. The Zeppelin internal Spark interpreter needs super user privileges for creating databases and other various writes.
UPDATE 5-23: Don’t use sudo . If you do it once, you’ll have to do it always, and having Zeppelin running as super user is unwise and unnecessary.
Test flight of our new Zeppelin…
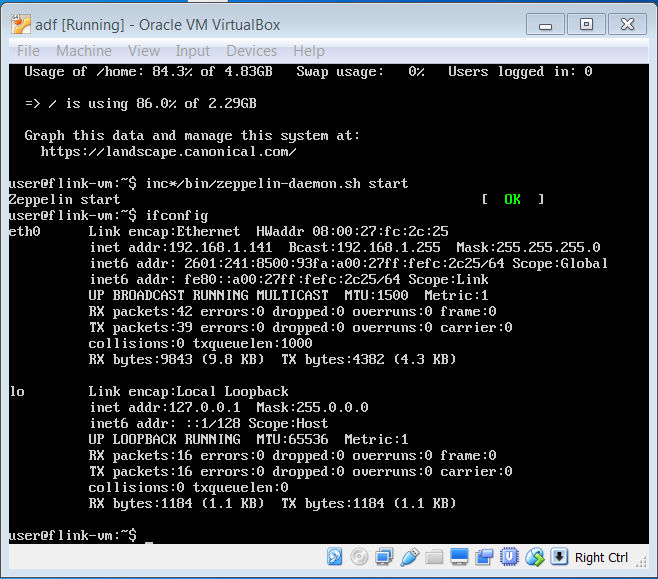
First determine the local IP address of the machine hosting Zeppelin.
ifconfig
This is the output from my machine, your numbers will be different.
See that the IP of my machine is 192.168.1.109, yours will be different. In subsequent screenshots, in the browser address you will see this IP, however for those following along at home, you need to use your own IP address.
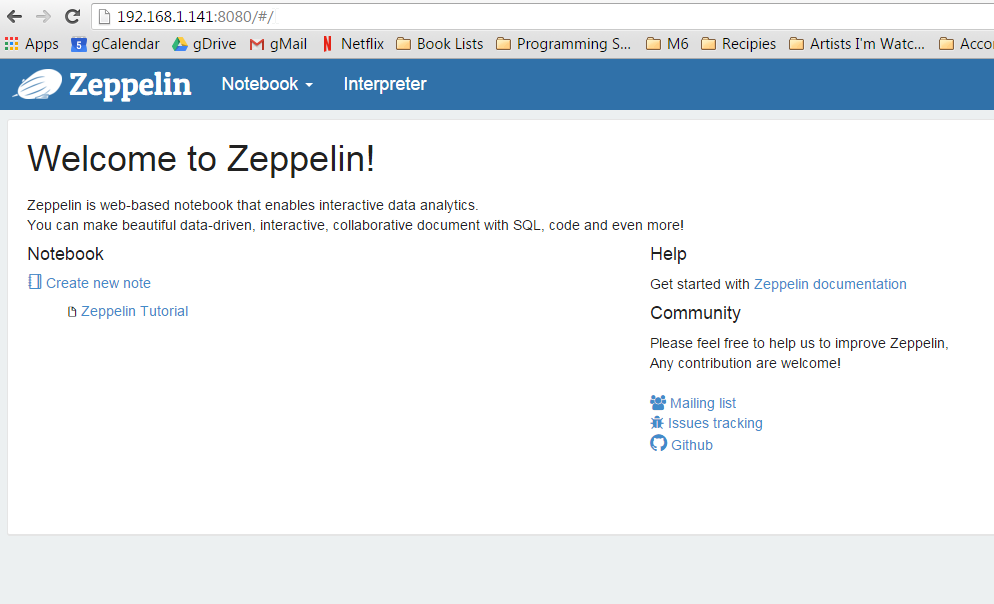
Open a browser and surf to http://yourip:8080, where yourip is the IP you found in the inet addr: field under the eth0 section. Port 8080 is the default port of the Zeppelin WebUI.
Guten Tag, Zeppelin.
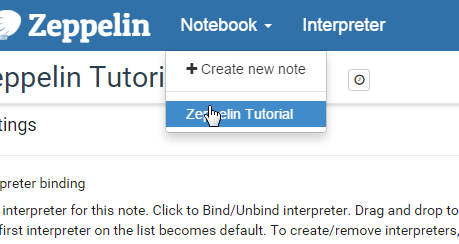
Open the Tutorial Notebook by clicking on Notebook -> Zeppelin Tutorial
Do this.
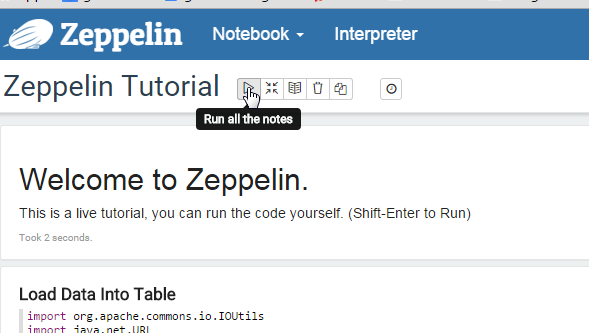
When you open the tutorial notebook it will ask you to bind the interpreters, just do it by clicking save. Now run all of the examples in the notebook to make sure they are working. You can do this by going to each cell and clicking Shift+Enter or by clicking the little play button at the top of the note.
Now we are going to do a couple of simple examples in Flink and Spark. Zeppelin comes pre-built with its own Flink and Spark interpreters, and will use these until we have it pointed at our own cluster (which happens later). For now, we’re going to test some basic functionality of Zeppelin by running a Flink and a Spark word count example against the internal interpreters.
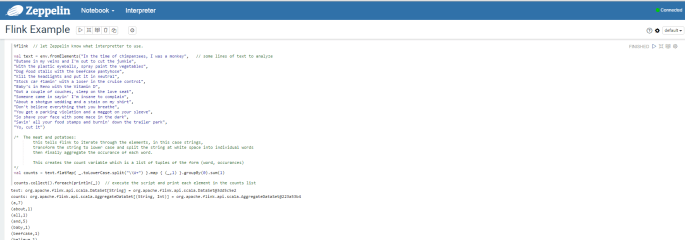
Flink Example
First, create a new notebook. Do this by clicking on Notebook -> Create New Notebook. Name this notebook “flink example”. Zeppelin doesn’t automatically open the notebook you’ve created, you’ll have to click on Notebook again and the name you gave the new notebook will appear in the list.
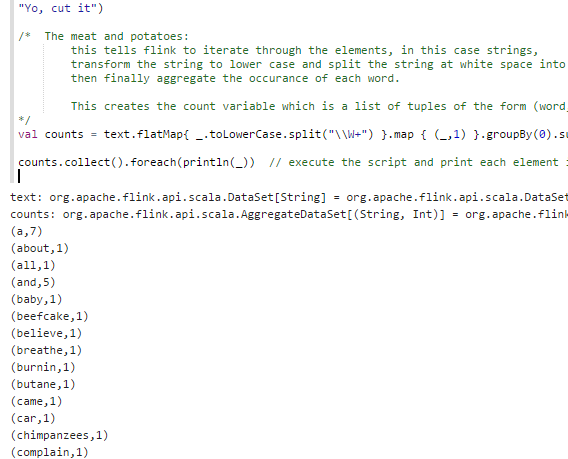
You can find a Flink word count gist here. Copy and paste the code from the gist into the Zeppelin note and either hit Shift+Enter or click the play button to run the paragraph.
Hopefully you see something like this…
Spark Example
Create another new notebook, call this one “spark example”, and open it.
Assuming your examples are working go ahead and stop Zeppelin.
bin/zeppelin-daemon.sh stop
Installing Flink and Spark Clusters
There are lots of how to guides for getting full blown Flink and Spark clusters set up. For this example, we’re just going to install a stand alone of each. The important thing in this tutorial is how to get Zeppelin aimed at Flink and Spark instances outside of the ones that come prepackaged. These external versions can be scaled/built/setup to suit your use case.
Download, checkout, and start Flink
Download
We change directory back to our home directory
cd $HOME
Then clone the Apache Flink repository
git clone https://github.com/apache/flink.git
Then check out release-0.10 1.0
git checkout release-0.10
git checkout release-1.0
UPDATE 5-23: We’re on release 1.0 now. Release 1.1 (which is what the master branch is on has some cool new stuff like streaming in the shell, but will also break backwards compatibility, e.g. it won’t work). I have a PR that makes it work, but I’ll save that for a future blog post.
And finally, build the package.
mvn clean package -DskipTests
Building Flink took 20 minutes on my virtual box.
Start Flink
Now start Flink with the following command:
build-target/bin/start-cluster.sh
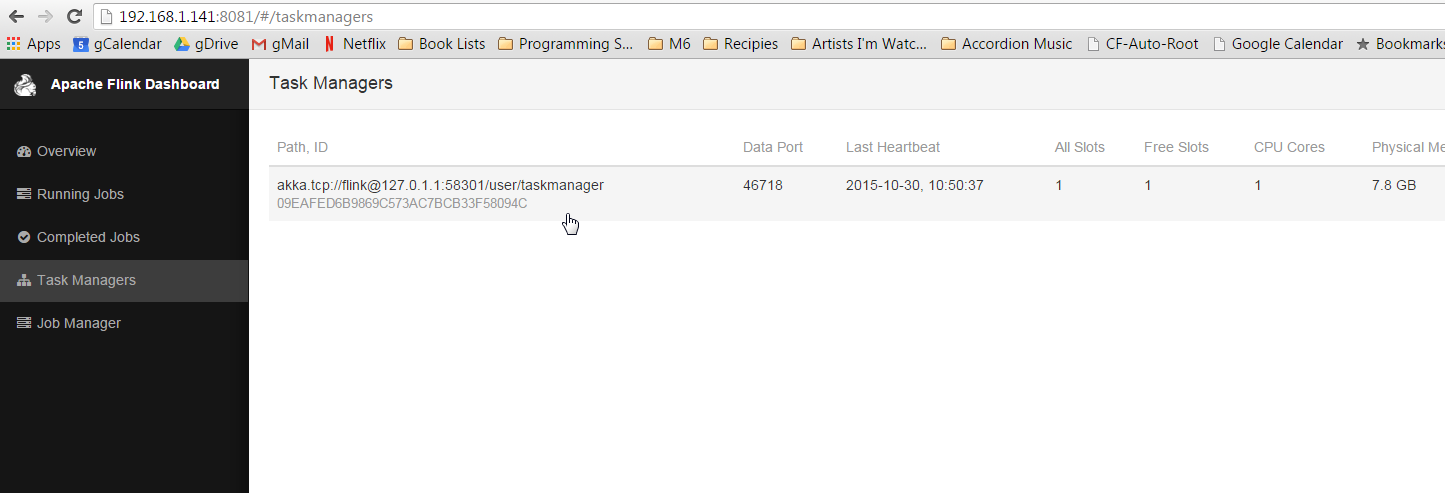
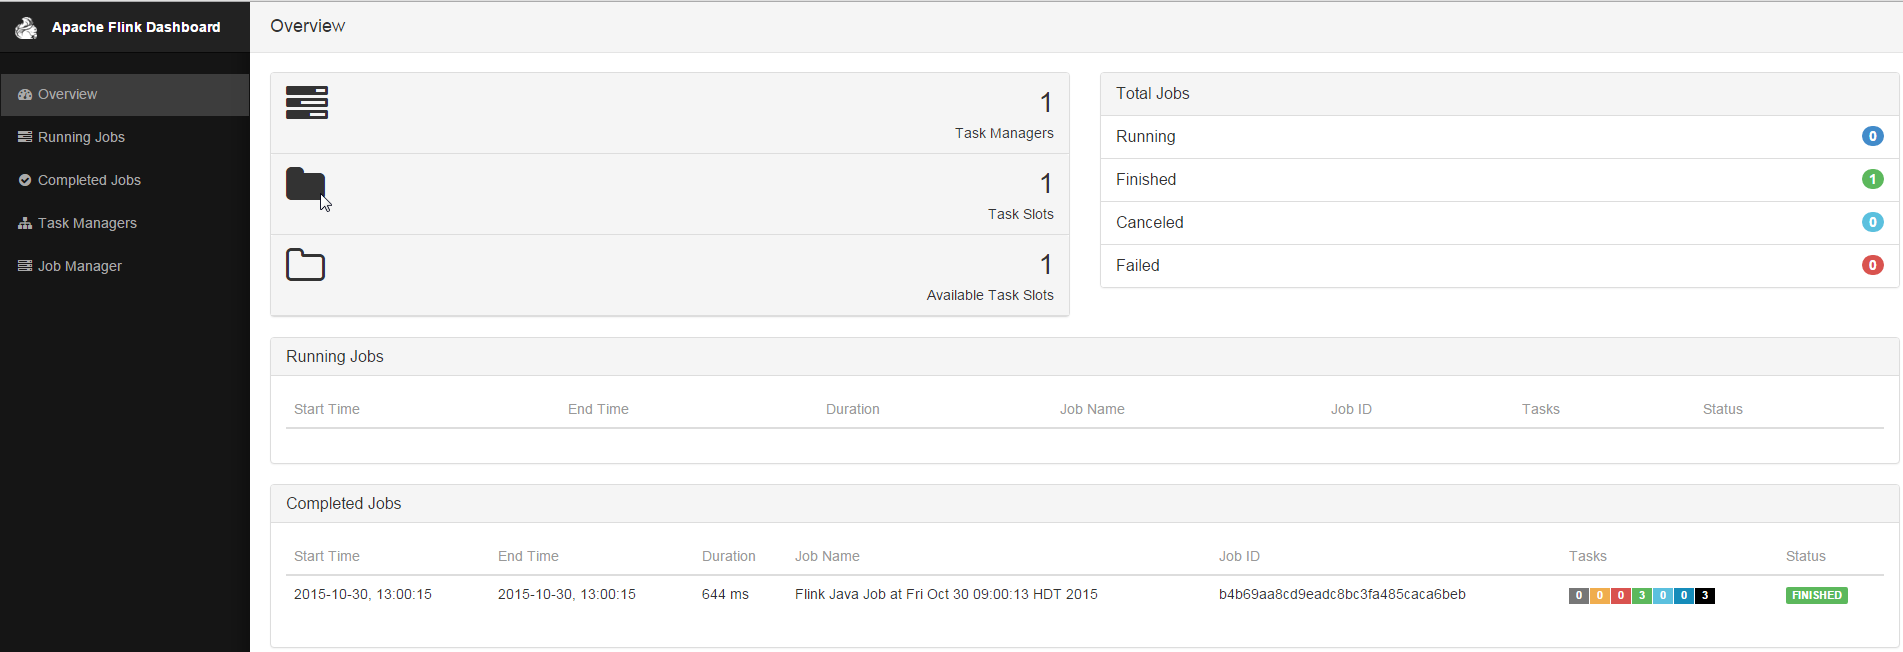
Now go to http://yourip:8081 and check out the Flink web-ui.
Oh, hello there new friend.
Make sure there is something listed under the task manager. If there is nothing stop and restart the flink cluster like this:
UPDATE 5-23: We’re on branch 1.6 now, and we want SparkR support.
And finally, build the package.
mvn clean package -DskipTests
Building Spark took 38 minutes on my virtual box.
Start Spark
In a cluster, you have a boss that is in charge of distributing the work and collecting the results and a worker that is in charge of actually doing the work. In Spark these are referred to as the master and slave respectively.
In Flink we could start an entire stand alone cluster in one line. In Spark, we must start each individually. We start the master with a flag --webui-port 8082. By default the webui-port is 8080, which is already being used by Zeppelin.
sbin/start-master.sh --webui-port 8082
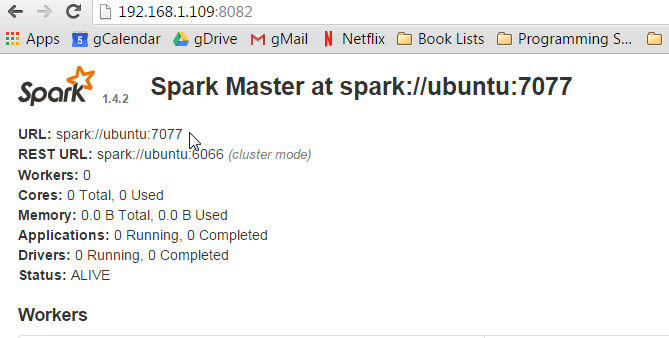
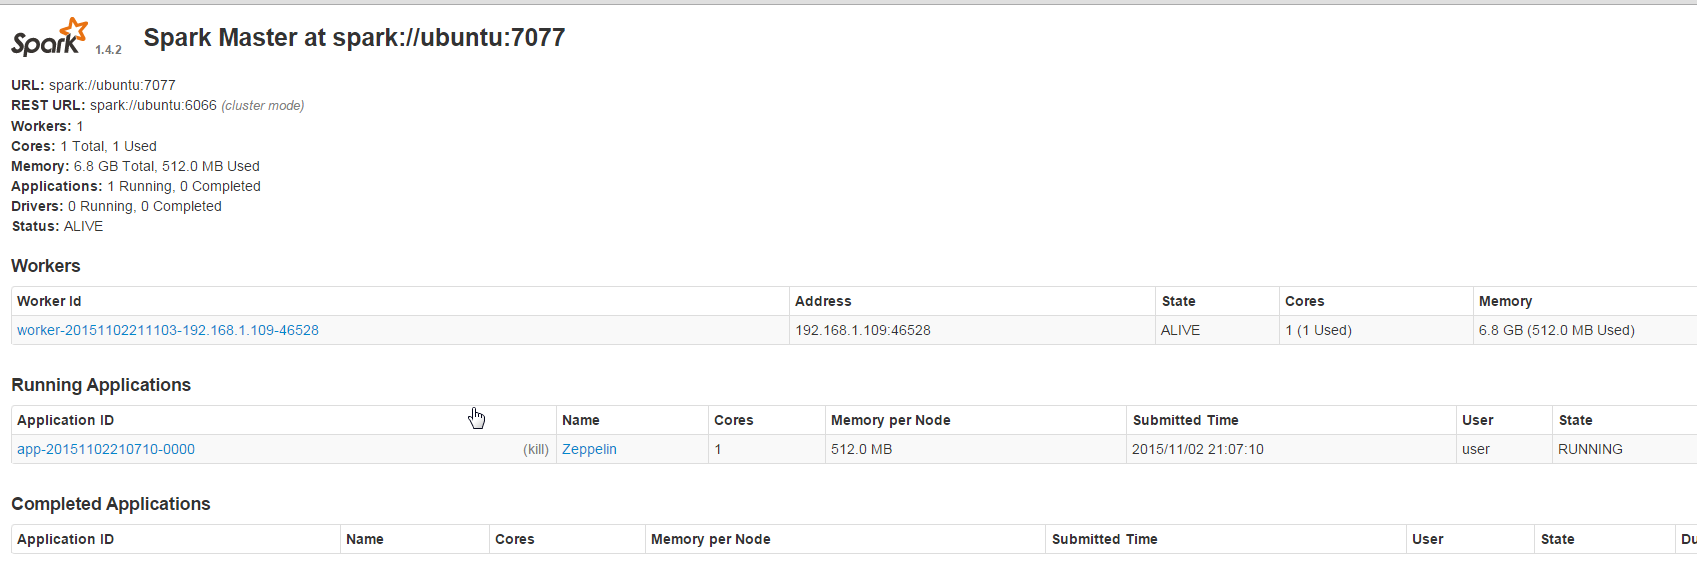
Now go check out the Spark master web-ui. It will be at http://yourip:8082.
Note the URL listed. spark://ubuntu:7077. My URL is ubuntu because that is the name of my host. The name of your host will be what ever you set it up as during install. Write this url down, because next we are starting the slave. We have to tell the slave who its master is.
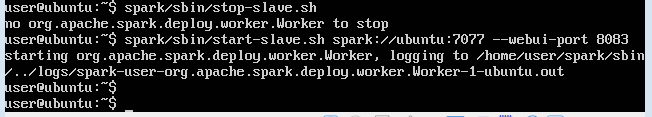
sbin/start-slave.sh spark://yourhostname:7077
The argument spark://yourhostname:7077 lets the slave know who its master is. This is literally the master’s URL. If you have another computer with Spark 1.4 installed you could run this line again (substituting ubuntu for the IP address of the master machine) and add another computer to your cluster.
Gotchya
For those that are not reading carefully and just copying and pasting, you probably won’t see this for a while anyway, but I want to say again, unless you just happen to have named your host ubuntu you need to change that to what ever the name is you found for the Master URL in the Spark Web-UI…
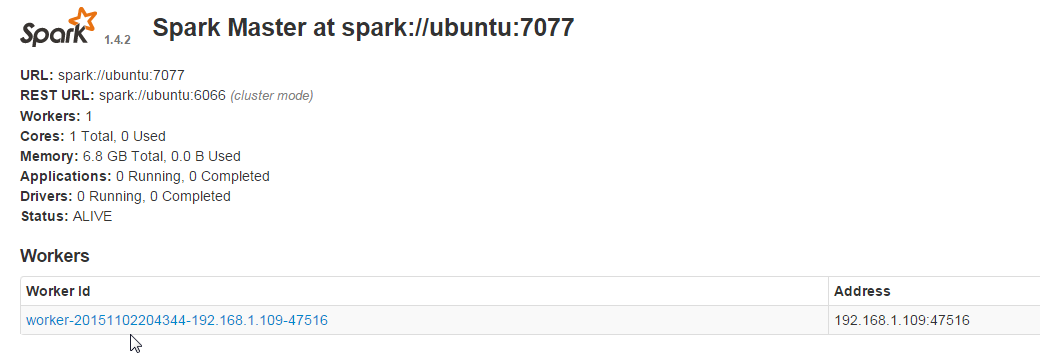
Now go back to your master webui and you should see the slave listed under workers.
Start Zeppelin
Now everything is technically up and running. All we have left to do, is start Zeppelin back up, tell it to run code against our clusters (instead of the internal interpreters), and check that our examples still work.
Start Zeppelin with the following
cd $HOME
incubator-zeppelin/bin/zeppelin-daemon.sh start
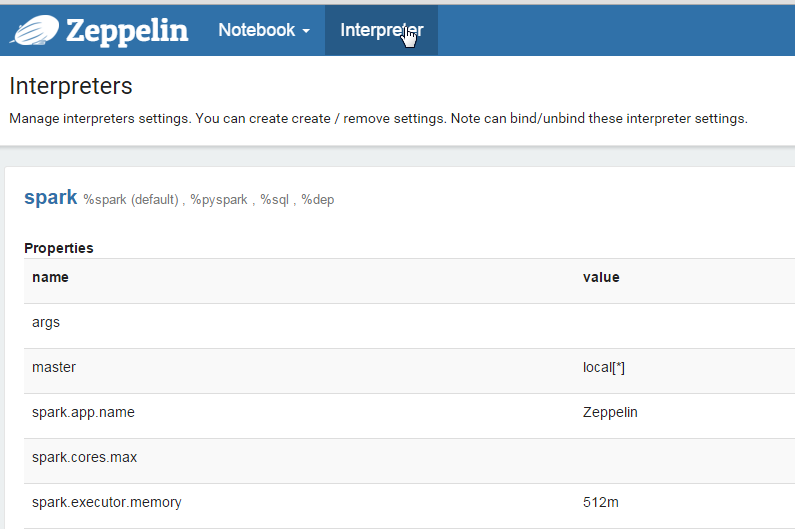
Now go back to the Zeppelin web-ui at http://yourip:8080 and this time click on Interpreters at the top of the screen.
In the Spark section, click the edit button in the top right corner to make the property values editable. The only field that needs to be edited in the Spark interpreter is the master field. Change this value from local[*] to the URL you used to start the slave, mine was spark://ubuntu:7077.
Edit the spark and flink interpreters.
Click ‘Save’, then scroll down to the Flink section. Click ‘edit’ and change the value of host from local to localhost. Click ‘Save’ again.
Now open the Flink notebook we made earlier.
Hit Shift+Enter or hit the play button at the top of the notebook to run the paragraphs. Hopefully the result is the same as before. Now in a new tab, go to the Flink Web-UI at http://yourip:8081. You should see the job has completed successfully on the cluster.
It’s beeeeeautiful!
Now open the spark example notebook from earlier and rerun this as well. After this notebook has run successfully go to the Spark Web-UI at http://yourip:8082 and see the job has run on this cluster.
Is great success.
Gotchya
if the Spark job seems to hang, go to the Spark Web-UI. If there is a job listed under running applications, but there are no workers listed, the slave has died, go back to the command line and run
cd $HOME
spark/sbin/start-slave.sh spark://yourhostname:7077
where yourhostname is the hostname you have been using for the Master URL this whole time.
Necromancing the Spark slave.
Summary
Dude (or dudette), crack a beer. You just set up two of the most cutting edge big data engines available today in a cluster mode with an up-and-coming cutting edge (and pretty) web interface. Seriously, not a trivial task. Have you checked your linkedIn inbox in the last hour? because you probably have about 30 recruiters blowing you up.
Seriously though, It took me a couple of days smashing my head against the wall to make this rig work right and consistently. Seeing as I just saved you so much time, I think the least you could do is head over to, and sign up for, and participate in the user mailing lists for
Open source software is a beautiful thing, but it relies on a strong community. All of the projects, (and many more) could use your help, but especially Zeppelin which is still in incubator status.
(A thank you to the wonderful developers wouldn’t hurt either, they watch the mailing lists).
UPDATE 5-23: I let this go with out updates longer than I should have, and I’m sorry. To be honest, I probably won’t do it again. I’m older and wiser now, the things listed here should remain valid for sometime to come. The big changes are: