
Welcome back from Part 1. On our last episode we did an introduction, spoke briefly on the overall structure of the program, discussed our demo data source, and did some foreshadowing of this week. This week we’ll do a bit of what we foreshadowed.
The Streaming Engine
Or How to Do Weird Stuff with Apache Flink
Let’s start off by looking at some pictures. Let me show you the DAG of the Flink Streaming Job to provide some motivation, and then we can go through piece by piece and look at the implementations.
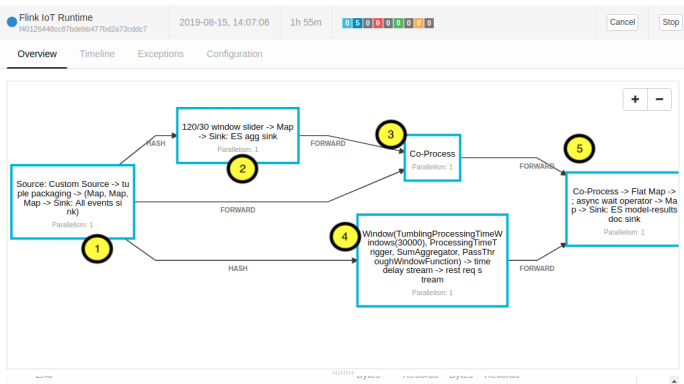
From the “architecture diagram” in Episode 1, this is what the Flink Job is doing.
- We pick up the data from MQTT
- We apply a sliding window doing some simple analytics on the data (Count, Min, Max, Average, Sum Squared Deviations, Standard Deviation)
- We join each record to the last analytics emitted from the sliding window
- We update the list of REST endpoints which serve the models every 30 seconds
- We send each Record + Last Emitted Analytics pair as a REST request to each model, and then sink the Record, Analytics, and Model Result (for each model) to Elasticsearch.
Pretty easy peasy. If you’re not interested in Apache Flink, you can basically stop here and know/understand that Record from Divvy Bike Station + Analytics + Model Results are sunk (written) into Elasticsearch and that by continuously polling an endpoint that returns other active endpoints we can dynamically add/delete/update the models being ran on this stream of data.
Getting Data from MQTT
Initially I was using a copy of luckyyuyong’s flink-mqtt-connector in my implementation and required some hacks and updates.
The most important call out is that MQTT will disconnect brokers with the same clientID because it thinks they are old and stale, so make we have to make the clientID random. This was a particularly nasty and inconsistent bug to track down, but turns out many other have had this problem. The solution here was just to add a string of milliseconds since the epoch. Probably would need something more for production but this is an MVP.
String clientBase = String.format("a:%s:%s", Org_ID, App_Id).substring(0, 10);
String clientID = clientBase + System.currentTimeMillis();
mqttProperties.setProperty(MQTTSource.CLIENT_ID, clientID );
Aside from that little quirk, this all works basically like an Apache Kafka or any other connector.
Apply the Sliding Window
This was a bit of a trick because I didn’t want to hard code the data structure into the engine. I would like to eventually auto determine the schema of the json, but because of time constraints I set it up to be passed as a command line argument (but ended up hard coding what the CLI argument would be – see here).
This is important because we don’t want the window to be trying to compute analytics on text fields, and the data coming in form MQTT is all going to look like a string.
If you look at the code in ProcessWindowAnalyticsFunction you can see that function expects a schema to come in with the records, and in that schema any field that is listed as ‘Numeric’ we will attempt to compute analytics on. Admittedly here, we are trading off performance for a single engine that will compute any data source.
Joining the Records and Last Reported Analytics
At this point, I had been doing A LOT of Java, which to be candid, I really don’t care for- so I switched over to Scala. It’s really not a particularly interesting function. It simply joins all records with the last reported analytics from the sliding window. You’re free to check it out here and make comments if you have questions. I realize there’s a lot of magic-hand-waiving and me telling the reader to “go look for yourself”, for this blog / tutorial, but I am assuming you are fairly familiar with all of the tools I am using and I’m trying to give the reader a high level view of how this all fits together. If you have specific questions, please ask in the comments or email me (you can find me around the interwebs pretty easily).
The “Other” Stream
Now let’s shift and consider our “other” stream. The stream that simply polls an endpoint which serves us other endpoints every thirty seconds. This is accomplished effectively by doing a time windowed stream on all of the events coming from the records source- throwing them all away, and then once every 30 seconds (but you could configure that), sending an Asyncy REST request to a preordained URL that holds the REST endpoints for the models.
You can see this in my github lines approx 140-159. The endpoint that this system is hitting is being served in Apache OpenWhisk (which I absolutely love if you haven’t been able to gleam from my other blog posts, it’s like AWS / Google Cloud Functions except not proprietary vendor lock-in garbage).
You can see the response this gives here. Obviously, a “next step” would be for this to hit some sort of database where you could add/delete entries. (If you’re to lazy to click, it basically just returns a json of { endpoints: [ { modelOneName: “http://the-url”}, …]}
Merging it All Together and Making Async Calls
Now we bring everything together. From one stream we have Device Event Records and analytics on those records, from the other we have a list of URLs which will serve models. Now- it’s worth pointing out here, that while not implemented in a “real” version an easy add would be to have another field in the model name that specifies what devices it applies to- since that model is expecting certain input fields and different devices will have different fields. Again- a MINIMUM viable product is presented.
The rest is pretty simple conceptually- for each record/analytics item- it goes through the list of all applicable URLs (in this case all of the URLs), and pings each with the record and analytics as the payload. The code is here and may be more illuminating. The magic happens in the main program right here.
The Async ping models is nice because as different requests come back at different speeds, they don’t hold up the rest of the stream. A bug/feature can be introduced though if you don’t want the entire program to go flying off the rails if there is a single REST request. To do that you must set the “timeout” of the Async function, my choice was to “ignore” but you could in theory re-request, allow up to X fails in a Y time, etc.
Conclusion
I want to state one more time- that this was a lot of waive-my-hands magic, and “go look for yourself”dom. I probably could have made a 5 part blog just out of this post- but 1. I’m trying to write a book on something else already, and 2. the point of this blog series is an over view of how I built a “full stack” IoT Analytics solution from scratch part time in a couple of weeks.
Next Time
We’ll follow our hero into his mis-adventures in React, especially with the Dread Design System: Carbon.
See you, Space Cowboy.